- docs
- FlowFuse User Manuals
- Using FlowFuse
- Getting Started
- Static asset service
- Bill of Materials
- FlowFuse Concepts
- Changing the Stack
- Custom Hostnames
- Custom Node Packages
- Device Groups
- DevOps Pipelines
- Environment Variables
- FlowFuse Assistant
- FlowFuse File Nodes
- FlowFuse Project Nodes
- High Availability mode
- HTTP Access Tokens
- Instance Settings
- Logging
- persistent-context
- Shared Team Library
- Snapshots
- Team Broker
- Teams
- User Settings
- FlowFuse API
- Migrating a Node-RED project to FlowFuse
- Device Agent
- Device Agent
- FlowFuse Device Agent Introduction
- Quick Start
- Installation
- Register your Remote Instance
- Running the Agent
- Deploying your Flows
- Hardware Guides
- FlowFuse Cloud
- FlowFuse Cloud
- FlowFuse Self-Hosted
- Quick Start
- Installing FlowFuse
- Overview
- Configuring FlowFuse
- DNS Setup
- Docker install
- Docker from AWS Market Place
- Docker on Digital Ocean
- Add Project Stacks on Docker
- Docker Engine on Windows
- Email configuration
- First Run Setup
- FlowFuse File Storage
- Install FlowFuse on Kubernetes
- Upgrading FlowFuse
- Administering FlowFuse
- Administering FlowFuse
- Configuring Single Sign-On (SSO)
- Licensing
- Monitoring
- Telemetry
- User Management
- Support
- Community Support
- Premium Support
- Debugging Node-RED issues
- Contributing
- Contributing to FlowFuse
- Introduction
- Adding Template Settings
- API Design
- Creating debug stack containers
- Database migrations
- FlowFuse Architecture
- Local Install
- State Flows
- Device Editor
- Invite External Users
- User Login Flows
- Reset Password Flow
- Project Creation
- Instance states
- User Sign up Flow
- Team creation Flow
- Team Broker
- Working with Feature Flags
# Logs
FlowFuse presents log information in several different places depending on what you are interested in.
# Node-RED Logs
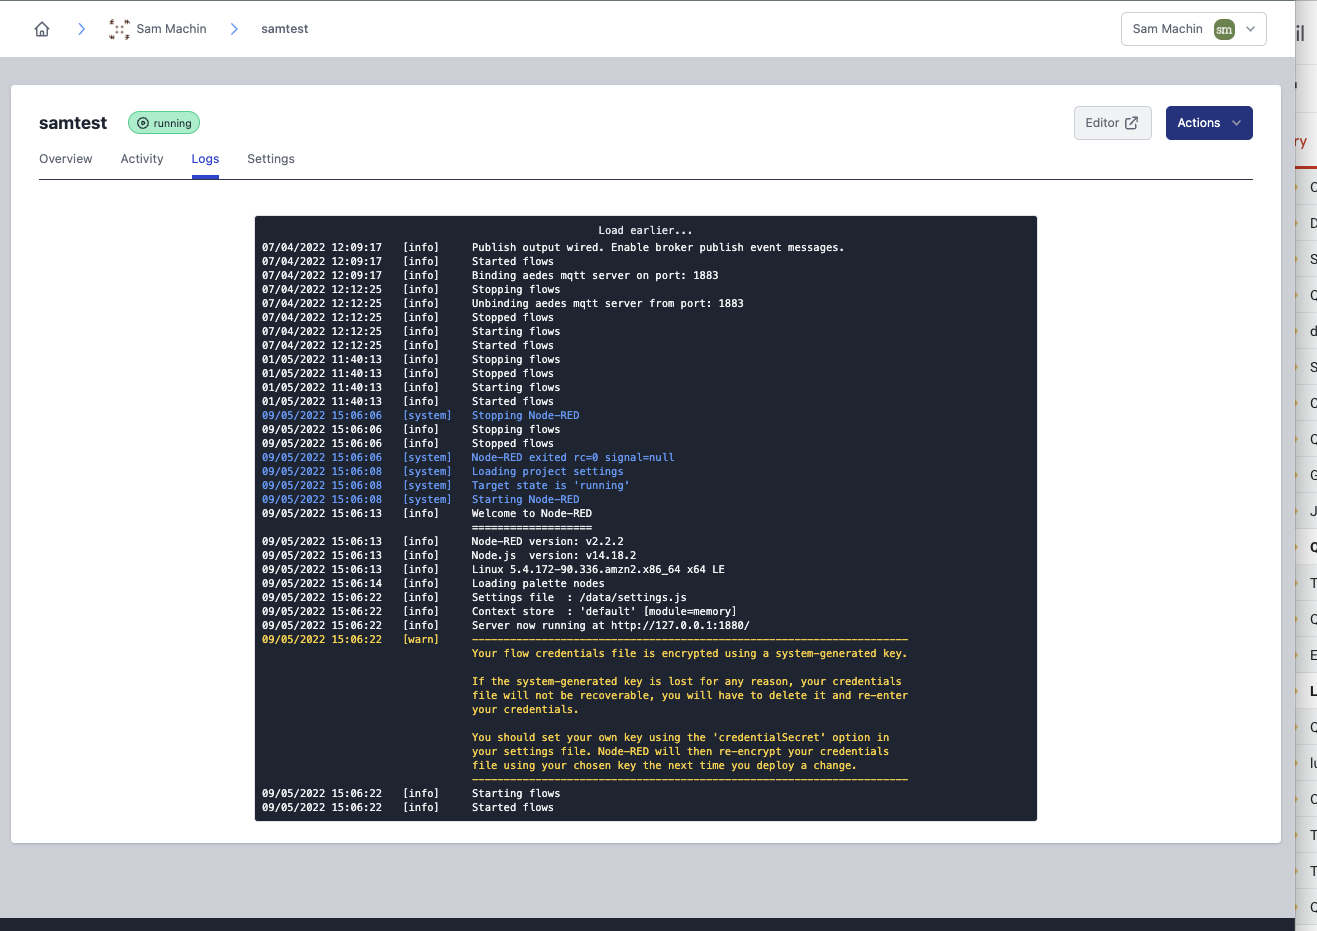
The Node-RED logs are available for all instances running within the platform.
They will contain information such as nodes being added and errors relating to your flows.
The log information is kept back to the last time the instance container was restarted, you can view older information on the Load earlier... link at the top of the log.

Node-RED logs can also be output from the Containers/Pods that run Instances on Docker or Kubernetes. This is enabled by the forge.logPassthrough option. More details can be found in the Configuration documentation.
# Audit Log
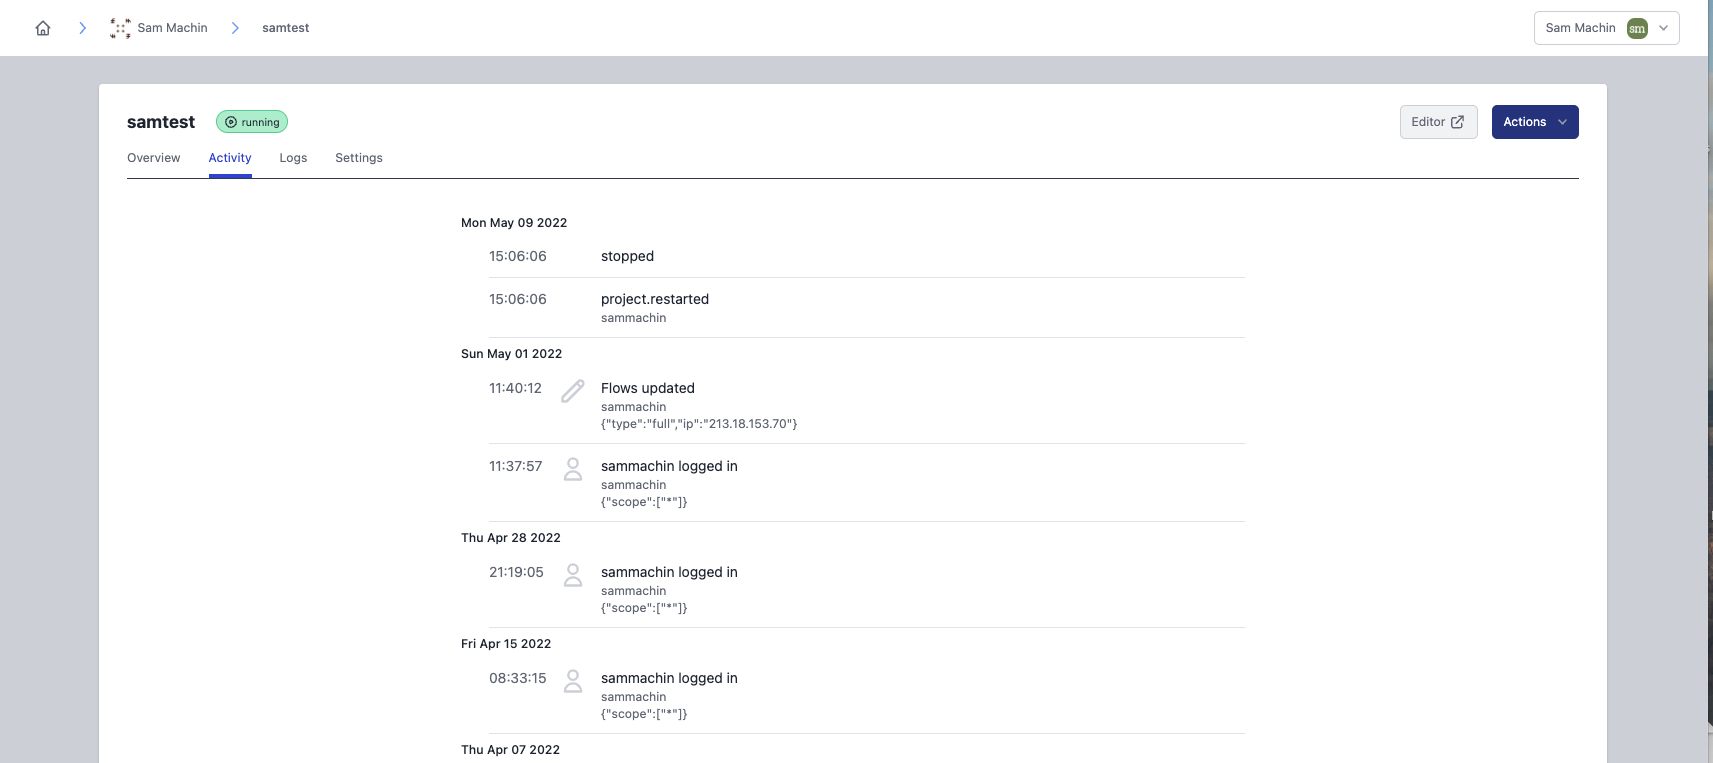
The Audit Log tab on the application and instance views shows key events that have happened.
The events include:
- User logging into the editor
- Flows being updated
- Nodes installed
- Snapshots being created
- Resource utilization warnings
This log contains all events since the instance was created. You can view older data using the Load More... link at the bottom of the log.

# Resource utilization warnings
If the CPU or memory usage exceeds 75% for more than 5 minutes, a warning will be displayed in the Audit Log, indicating that measures such as upgrading the instance are recommended.
# Team Audit Log
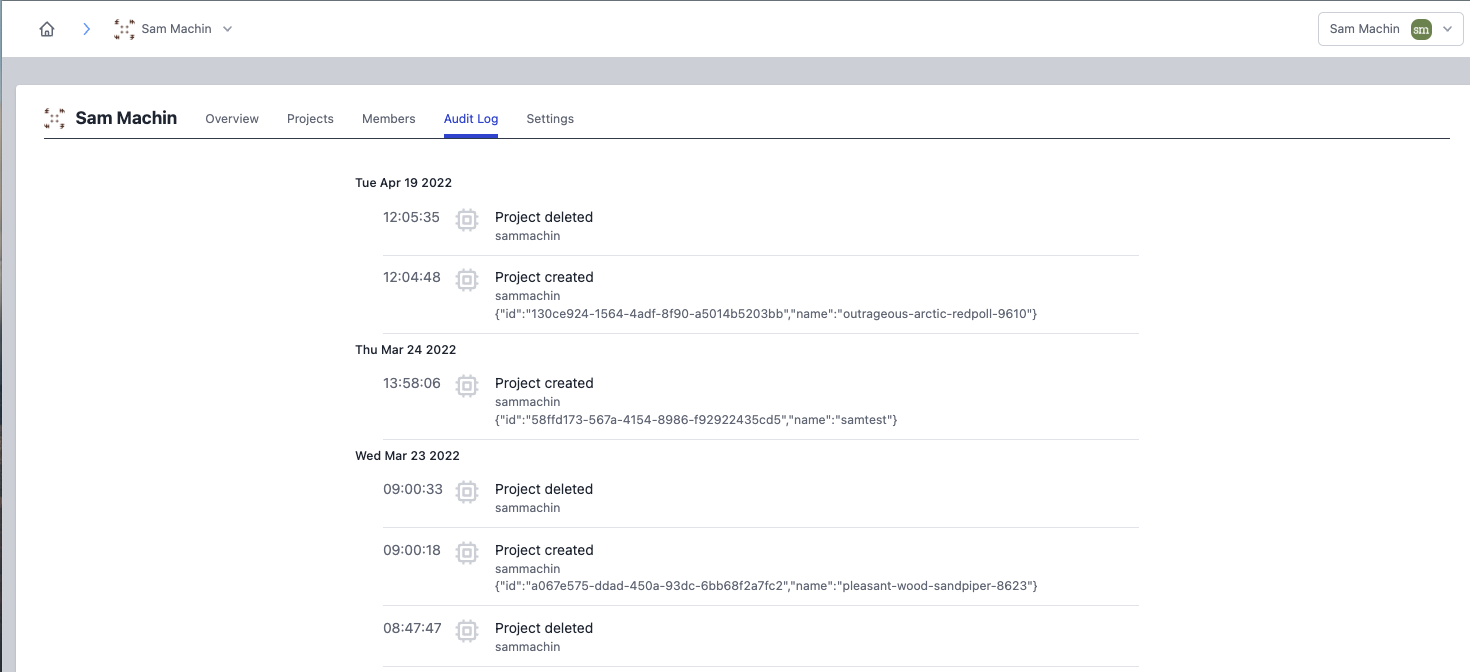
From the Team page the Audit Log shows events relating to the management of the team.
This includes:
- Applications/Instances being created or deleted
- Users being added/removed from the team
This log contains all events since the team was created. Tou can view older data using the Load More... link at the bottom of the log.
