Debug
Displays messages in the Debug sidebar for monitoring and troubleshooting flows.
Where and why do we use the Debug node?
The Debug node helps you understand the messages and data traveling through your flows. It's essential during development for monitoring data transformations, verifying logic, and troubleshooting issues. By adding Debug nodes at key points in your flow, you gain visibility into what's being passed between nodes, making it easier to identify problems and validate that your flow works as expected.
Modes of operation
The Debug node can output message data in several ways:
Message Property Output
Output any property of the message object, such as msg.payload, msg.topic, or any custom property like msg.my_property. This is the most common mode for inspecting specific data as it flows through your nodes.
Complete Message Object
Output the entire message object with all its properties. This reveals the full structure of the message, including metadata and properties you might not know exist. This mode is valuable when you need to understand the complete context available to downstream nodes.
JSONata Expression
Use JSONata expressions to transform and format message properties into more readable output. This lets you extract nested values, perform calculations, or format data in ways that make debugging easier.
Output destinations
The Debug node can send output to multiple locations:
Debug Sidebar
Messages appear in the Debug sidebar panel on the right side of the Node-RED editor. This is the primary debugging interface where you can inspect messages, expand objects, and use helper features like Copy Path and Copy Value.
System Console
Output is sent to the terminal or console where Node-RED is running. This is useful for debugging when the Node-RED editor is not open or when you need persistent logs.
Node Status
Output appears as status text below the node in the flow editor. This provides at-a-glance information without opening the Debug sidebar. You can display the same content as the debug output, show different properties, use JSONata expressions, or display a message counter.
How the node handles messages
The Debug node passes messages through unchanged to any connected nodes. It's purely observational and doesn't modify the message flow. This means you can add Debug nodes anywhere in your flow without affecting the behavior.
When displaying output, the Debug node truncates very large messages to prevent performance issues. You can expand truncated sections in the Debug sidebar to see the full content.
The node can be enabled or disabled without modifying the flow. A disabled Debug node (shown greyed out) still passes messages through but doesn't output anything, useful for reducing console noise in production.
Helper features
Copy Path
The Copy Path feature lets you quickly copy the property path of any value in the debug output. This is a real time saver when building Change or Function nodes, helping you avoid typos and errors. Simply click the small icon next to any property in the debug output to copy its full path.
Copy Value
Copy Value gives you an exact copy of any property value to use in Inject, Change, or Function nodes. This is extremely useful when you need to simulate real data or when sharing example flows with others for troubleshooting. Click the value in the debug output and select Copy Value from the menu.
Pin Open
When debug output contains many nested properties, Pin Open helps you keep specific items expanded while collapsing others. This makes it easy to focus on the data you care about without losing your place as new messages arrive.
Examples
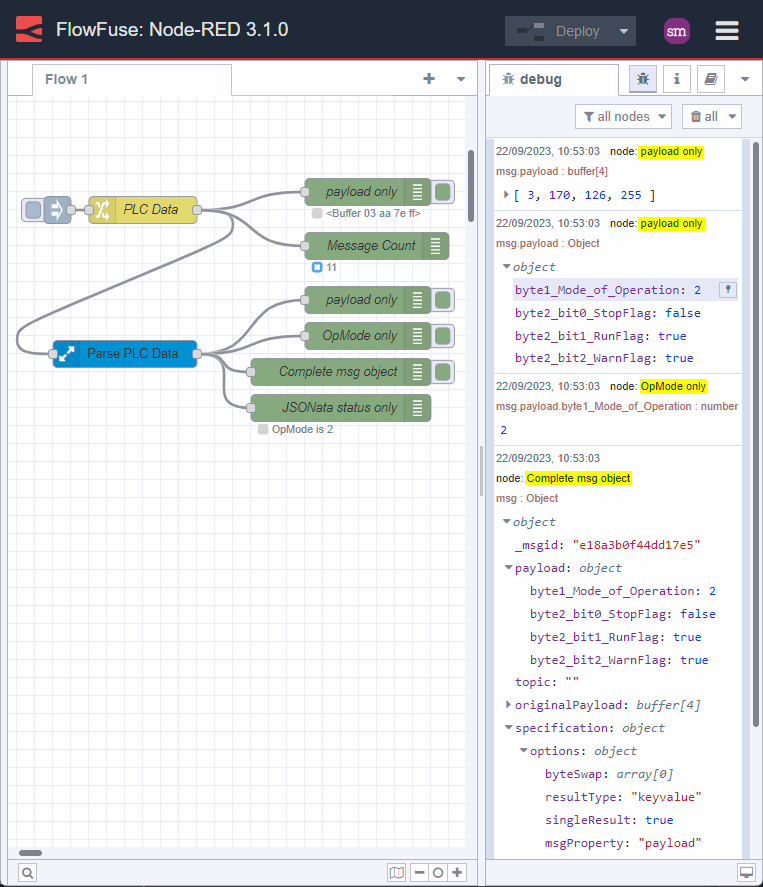
This example demonstrates common ways to use the Debug node for visualizing data and assisting development. It shows outputting to the sidebar, displaying node status, and using JSONata expressions.
Node Documentation
Displays selected message properties in the debug sidebar tab and optionally the runtime log. By default it displays msg.payload, but can be configured to display any property, the full message or the result of a JSONata expression.
Details
The debug sidebar provides a structured view of the messages it is sent, making it easier to understand their structure.
JavaScript objects and arrays can be collapsed and expanded as required. Buffer objects can be displayed as raw data or as a string if possible.
Alongside each message, the debug sidebar includes information about the time the message was received, the node that sent it and the type of the message. Clicking on the source node id will reveal that node within the workspace.
The button on the node can be used to enable or disable its output. It is recommended to disable or remove any Debug nodes that are not being used.
The node can also be configured to send all messages to the runtime log, or to send short (32 characters) to the status text under the debug node.