Using TimescaleDB with Node-RED (2026 Updated)
In the context of IoT and IIoT applications, time series databases are essential for storing data based on timestamps. While InfluxDB has been a popular choice for a long time, another time series database, TimescaleDB, is gaining popularity. This guide will cover how to use TimescaleDB with Node-RED, how TimescaleDB works, and the queries needed when building IoT applications.
If you prefer video tutorials, a few months ago, Grey, OT Data & Community Strategist at Flowfuse, conducted a live session on TimescaleDB.
What is TimeScaleDB
TimescaleDB is a time-series database built on PostgreSQL for efficiently handling large volumes of event data. This means that a TimescaleDB runs within an overall PostgreSQL instance which enables it to take advantage of many of the attributes of PostgreSQL such as reliability, security, and connectivity to a wide range of third-party tools.
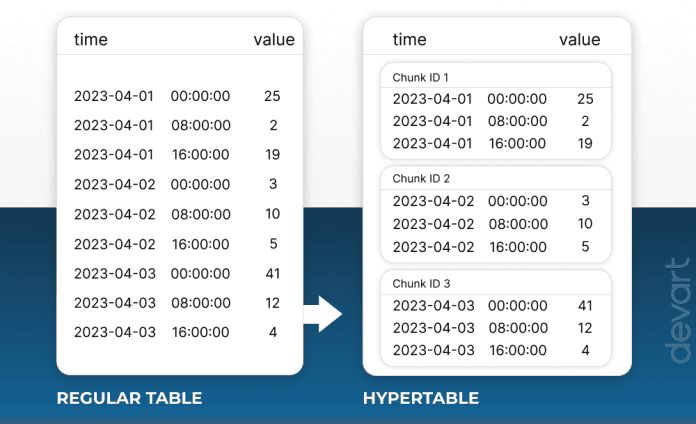
Unlike PostgreSQL, TimescaleDB uses a distributed hypertable architecture that automatically partitions your data by time. You interact with hypertables in the same way as regular PostgreSQL tables, but with extra features that make managing your time-series data much easier. Each hypertable consists of multiple PostgreSQL tables (chunks). Each chunk is assigned a range of time and only contains data from that range.
Setting up TimescaleDB environment
Installing TimescaleDB locally
If you want to install TimescaleDB locally, you can follow their official documentation on Install TimescaleDB.
Using TimescaleDB cloud option
TimescaleDB also offers a cloud option that simplifies deployment and management. Here’s how to set it up:
- Go to the Timescale Cloud website and sign up for an account.
- Once logged in, create a new TimescaleDB service by following the on-screen instructions.
- Choose your service settings, such as region, CPU, memory, and storage requirements, based on your application's needs.
- After creating the service, you’ll see the connection details. If you cannot see them, go to the "Services" option in the sidebar, click on the created service, and then in the "Overview" tab at the bottom, you will see your configuration details.
Using TimescaleDB with Node-RED
In this section of the guide, we will explore integrating TimescaleDB with Node-RED. We'll cover creating and deleting Hypertables, and inserting, updating, and deleting data from these tables. Additionally, we'll delve into advanced queries for comprehensive data analysis. Throughout this guide, we'll use a temperature example to illustrate each operation.
Installing PostgreSQL Custom Node
Since TimescaleDB is built on top of PostgreSQL, we can use the PostgreSQL node.
- Click the Node-RED Settings (top-right).
- Click "Manage Palette".
- Search for
node-red-contrib-postgresql. - Click "Install".
Configuring PostgreSQL node with TimescaleDB configurations
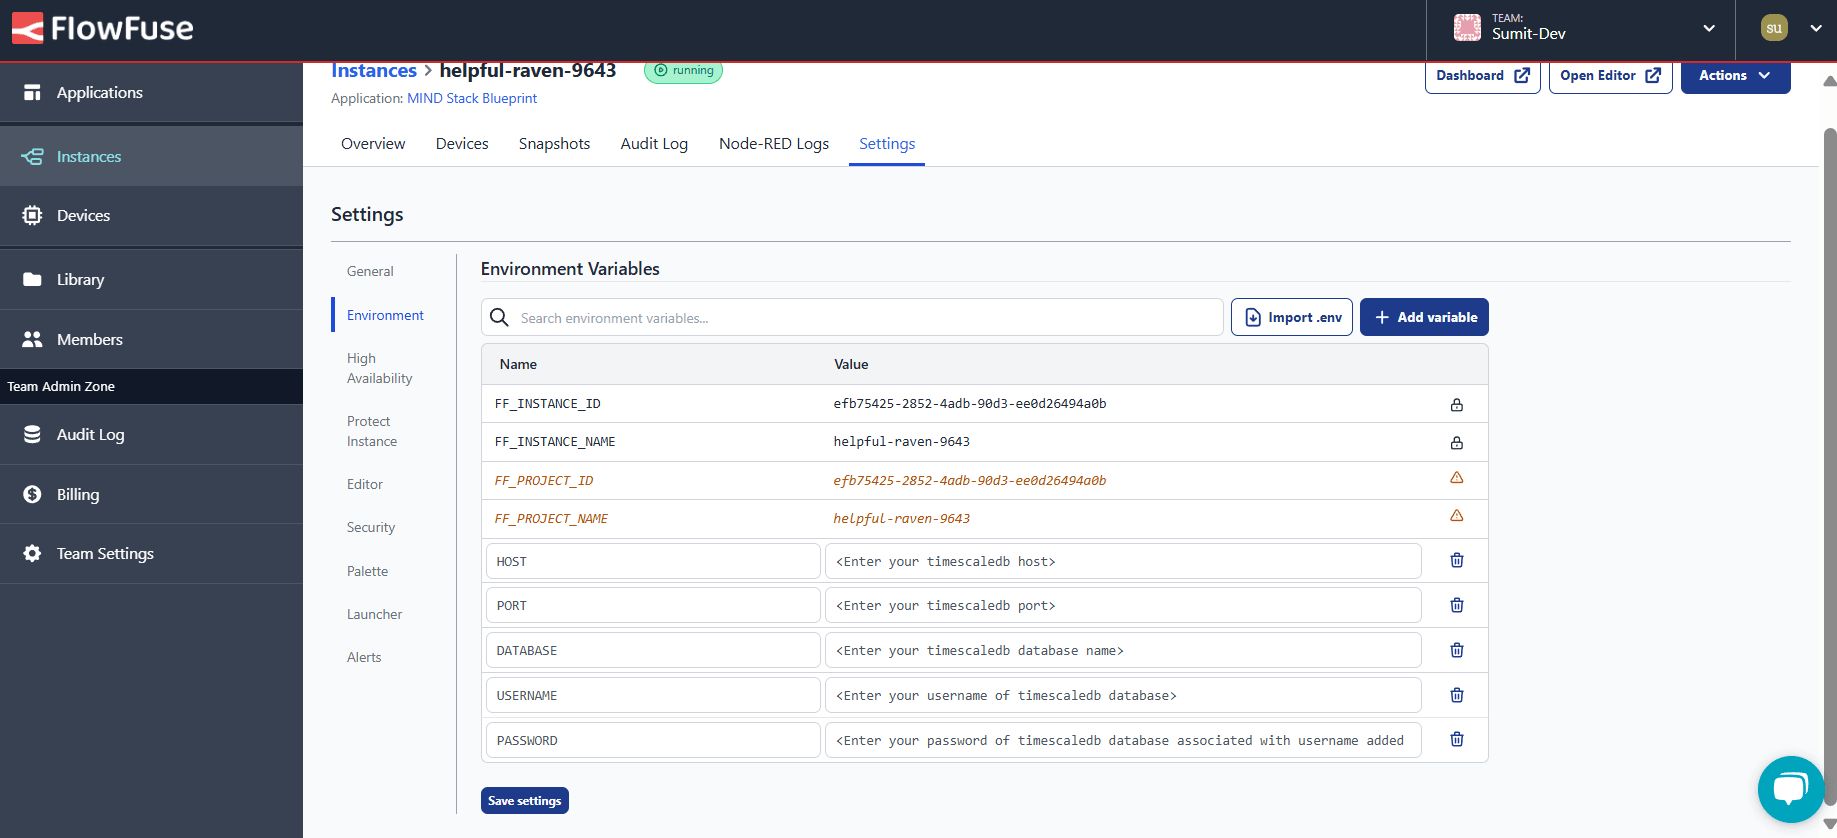
Before proceeding, make sure you have added environment variables for your TimescaleDB configuration details. For more information, refer to Using environment variables with Node-RED.
- Drag a PostgreSQL node onto the canvas and double-click on it.
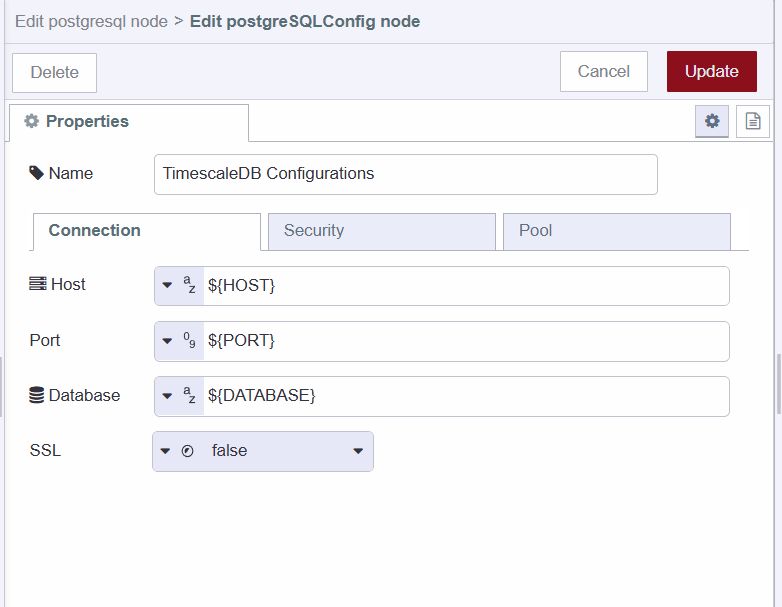
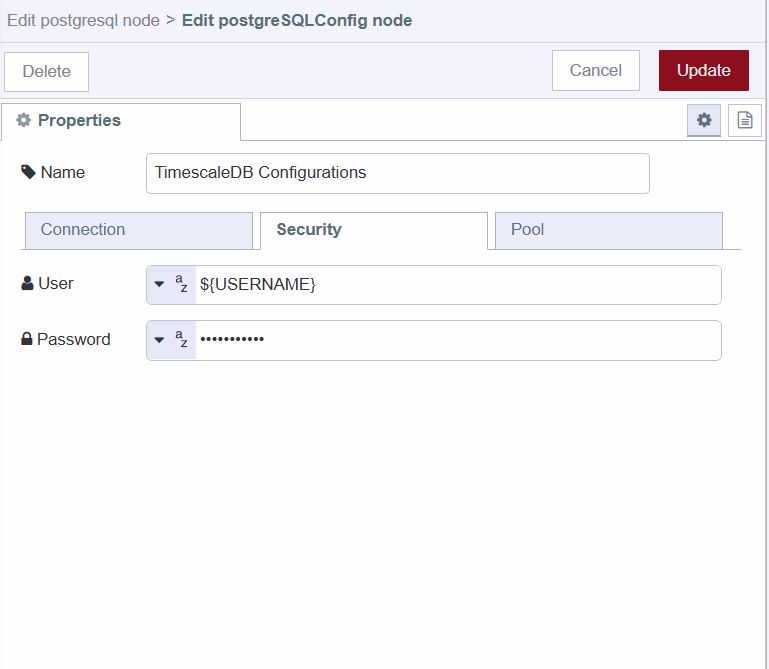
- Click on the edit icon next to the Server input field to add configuration details in the PostgreSQL config node.
- Enter the environment variables set for each of your configuration details in the corresponding input fields.
Creating Hypertables
To create a hypertable, start with creating a standard PostgreSQL table and convert it into a hypertable.
- Insert the following SQL commands into the PostgreSQL node's query field.
-- Create a standard PostgreSQL table

CREATE TABLE sensor_data (
        time TIMESTAMPTZ NOT NULL,
        location STRING,
 temperature DOUBLE PRECISION
 );

-- Convert the table into a hypertable for efficient time-series data management
SELECT create_hypertable('sensor_data', 'time');- Drag an Inject node onto the canvas, which we will use to trigger the operation.
- Connect the Inject node's output to the input of the PostgreSQL node.
Inserting Data into the Table
The steps to insert data into a TimescaleDB Hypertable are similar to inserting data into a standard PostgreSQL table.
- Drag the Inject nodes onto the canvas.
- Set the
msg.payload.temperatureto the JSONata expression$floor(($random() * 21) + 30)which will generate random data for us, andmsg.payload.locationto "New York" for the first Inject node, and do the same for the second Inject node but with a different location.
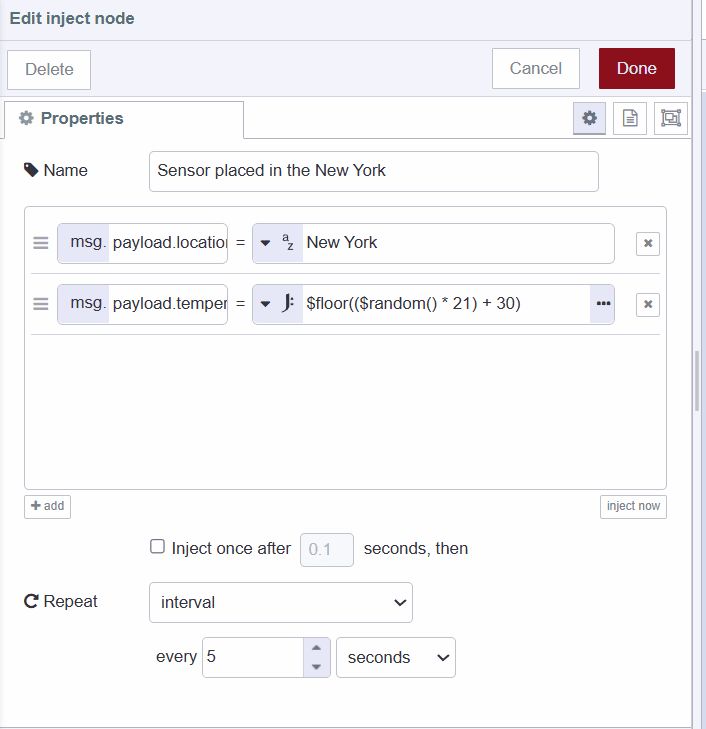
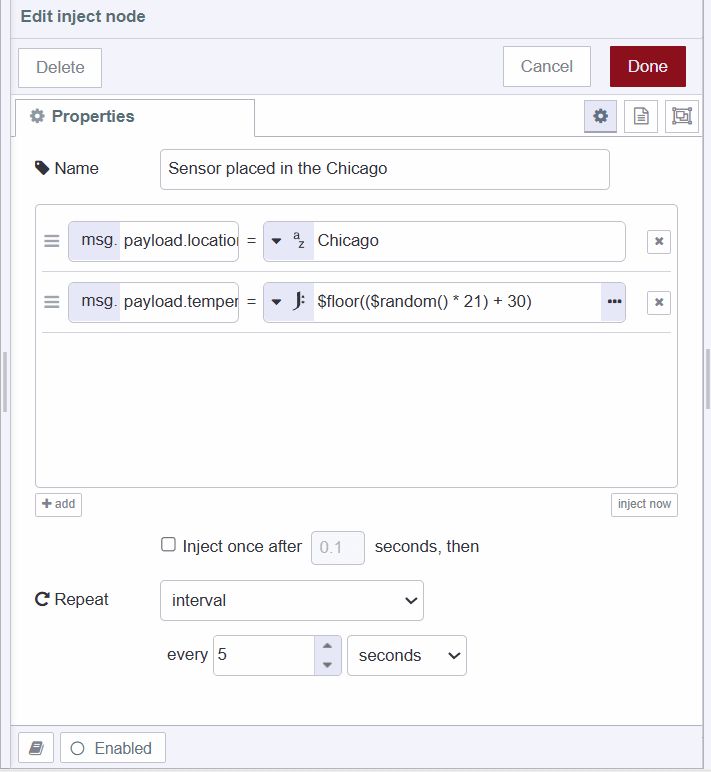
- For both Inject nodes, set the repeat interval to 5 seconds, which inserts data every 5 seconds.
- Drag a PostgreSQL node onto the canvas and insert the following SQL command into the query field:
-- Insert a new row into the sensor_data table
INSERT INTO sensor_data (time, location, temperature)
VALUES (
    now(), -- Current timestamp
    '', -- Location of the sensor reading
    '' -- Temperature recorded by the sensor
);
- Drag a Debug node onto the canvas.
- Connect the output of the Inject nodes to the input of the PostgreSQL node and the output of PostgreSQL to the input of the Debug node.
Updating data to the table
When you need to update multiple rows of a table based on specific conditions, you can do so as follows. In the following flow, we are updating the temperature of rows where the time falls within the specified time range to increase by 0.1 degree:
- Drag an Inject node onto the canvas.
- Drag a PostgreSQL node onto the canvas and insert the following SQL command into the query field:
-- Update temperature data in the sensor_data table
UPDATE sensor_data
  SET temperature = temperature + 0.1
  WHERE time >= '2024-05-29 16:40' -- Starting timestamp for the update
AND time < '20124-05-29 16:50'; -- Ending timestamp for the update- Drag a Debug node onto the canvas.
- Connect the output of the Inject node to the input of the PostgreSQL node and the output of the PostgreSQL node to the input of the Debug node.
Deleting data to the table
- Drag an Inject node onto the canvas.
- Drag a PostgreSQL node onto the canvas and insert the following SQL into the query field:
-- Delete rows from the sensor_data table where the temperature is below 35 degrees Celsius or humidity is below 60%
DELETE FROM sensor_data
WHERE temperature < 35 -- Delete rows where the temperature is less than 35 degrees Celsius- Drag a Debug node onto the canvas.
- Connect the output of the Inject node to the input of the PostgreSQL node and the output of the PostgreSQL node to the input of the Debug node.
Retrieving all data from the table
- Drag an Inject node onto the canvas.
- Drag a PostgreSQL node onto the canvas and insert the following SQL into the query field:
-- Retrieve all rows from the sensor_data table
SELECT * FROM sensor_data;- Drag a Debug node onto the canvas.
- Connect the output of the Inject node to the input of the PostgreSQL node and the output of the PostgreSQL node to the input of the Debug node.
Retrieve Recent Data
In situations where you need to quickly access the most recent data, such as monitoring real-time sensor readings or analyzing recent transactions, you can follow these steps:
- Drag an Inject node onto the canvas.
- Drag a PostgreSQL node onto the canvas and insert the following SQL into the query field:
-- Retrieve the most recent 100 rows from the sensor_data table, ordered by timestamp in descending order
SELECT *
FROM sensor_data
ORDER BY time DESC -- Order the results by timestamp in descending order
LIMIT 100; -- Limit the results to 100 rows- Drag a Debug node onto the canvas.
- Connect the output of the Inject node to the input of the PostgreSQL node and the output of the PostgreSQL node to the input of the Debug node.
Retrieve Data Based on Time Range
When you need to retrieve historical records within a specific time frame, follow these steps:
- Drag an Inject node onto the canvas.
- Drag a PostgreSQL node onto the canvas and insert the following SQL command into the query field:
-- Retrieve data from the sensor_data table where the timestamp is within the last 400 seconds
SELECT *
FROM sensor_data
WHERE time > NOW() - INTERVAL '400 SECONDS';- Drag a Debug node onto the canvas.
- Connect the output of the inject node to the input of the PostgreSQL node, and connect the output of the PostgreSQL node to the input of the debug node.
Aggregating data into specific time bucket
Aggregating data involves combining multiple data points into summary statistics, usually over a specified time period or category. In the following flow, we aggregate sensor data from the last three hours into 15-minute intervals, computing summary statistics such as the maximum temperature per interval for each location.
- Drag an inject node onto the canvas.
- Drag a PostgreSQL node onto the canvas and insert the following SQL query into the query field:
-- Aggregate data into specific time buckets
SELECT time_bucket('15 minutes', time) AS fifteen_min, -- Create time buckets of 15 minutes
       location, -- Location of the sensor
       *, -- Select all columns
       MAX(temperature) AS max_temp -- Calculate the maximum temperature within each time bucket
FROM conditions -- Select data from the conditions table
WHERE time > NOW() - INTERVAL '3 hours' -- Filter data to include only the last 3 hours
GROUP BY fifteen_min, location -- Group data by time buckets and location
ORDER BY fifteen_min DESC, max_temp DESC; -- Order the results by time bucket in descending order, and then by maximum temperature in descending order- Drag the Debug node onto the canvas.
- Connect the output of the inject node to the input of the PostgreSQL node, and connect the output of the PostgreSQL node to the input of the debug node.
Dropping the table
- Drag an inject node onto the canvas.
- Drag a PostgreSQL node onto the canvas and insert the following SQL query into the query field:
-- Drop the table if it exists
DROP TABLE IF EXISTS sensor_data;- Drag the Debug node onto the canvas.
- Connect the output of the inject node to the input of the PostgreSQL node, and connect the output of the PostgreSQL node to the input of the debug node.
Deploying the Flow
- To test the imported flows, you need to deploy them. To do that, click on the deploy button located in the top right corner.
After deploying the flow, you can test each operation such as creating, deleting, updating, and other queries by clicking on the inject button. Upon successful operation, you will be able to see the results in the debug panel of the sidebar. If you want to learn any additional information about PostgreSQL, you can refer to the Using PostgreSQL with Node-RED where you will also find the section which shows the messages received after a successful operation by the PostgresWQL node.
Table of Contents
- What is TimeScaleDB
- Setting up TimescaleDB environment
- Using TimescaleDB with Node-RED
- Installing PostgreSQL Custom Node
- Configuring PostgreSQL node with TimescaleDB configurations
- Creating Hypertables
- Inserting Data into the Table
- Updating data to the table
- Deleting data to the table
- Retrieving all data from the table
- Retrieve Recent Data
- Retrieve Data Based on Time Range
- Aggregating data into specific time bucket
- Dropping the table
- Deploying the Flow