5 Whys vs. Fishbone Diagram: Which Is Right for You?
How the two root cause analysis methods differ, when to use each one, and how to combine them.


Use 5 Whys when the evidence points to one clear causal chain, a Fishbone Diagram when there are several possible causes, and both when you need to narrow down many causes and then dig into one.
A production problem can be easy to spot but much harder to explain. A machine stops, a defect appears, or a process starts producing inconsistent results. Fixing the immediate issue may get things back on track, but it does not always tell you why the problem happened in the first place.
That is where root cause analysis comes in.
5 Whys and the Fishbone Diagram are two common ways to investigate production problems. One helps you follow a cause deeper, while the other helps you organize possible causes when the situation is less clear.
Either way, the investigation needs evidence. Production data, machine readings, quality records, and process information can help you determine which causes are worth investigating.
So, how do you decide which technique to use?
5 Whys vs. Fishbone Diagram
The two methods differ mainly in how they structure an investigation.
| 5 Whys | Fishbone Diagram | |
|---|---|---|
| Best for | A problem with a clear or likely cause | A problem with several possible causes |
| Approach | Follows a chain of causes | Maps possible causes across categories |
| Main question | "Why did this happen?" | "What could be causing this?" |
| Investigation | Goes deeper into one line of reasoning | Explores different areas that may contribute |
| Team size | Works well with a small team | Often useful with a cross-functional team |
| Typical output | A chain leading toward an underlying cause | A structured map of possible causes |
| Can be combined? | Yes | Yes |
The table gives you the basic distinction. The sections below show how each method works in practice.
When Should You Use 5 Whys?
5 Whys works well when you can investigate a problem by repeatedly asking why one event led to another.
For example, suppose a production machine stops unexpectedly. The team finds that the motor overheated and starts asking why:
- Why did the motor stop? Because it overheated.
- Why did it overheat? Because the cooling fan was not running.
- Why was the fan not running? Because its power supply had failed.
The team can continue until it reaches a cause that explains the failure and can be addressed.
Despite the name, you do not have to ask exactly five questions. Five is a guideline, not a fixed rule. Some problems may take three questions, while others may require more.
The technique is most useful when each answer gives you a reasonable basis for the next question. If the investigation starts branching into several unrelated possibilities, another approach may be more useful.
For a deeper explanation, see our guide to 5 Whys root cause analysis.
When Should You Use a Fishbone Diagram?
A Fishbone Diagram helps a team organize the different factors that could be contributing to a problem.
For example, imagine that surface defects on a production line have suddenly increased. The team might investigate:
- Machine settings
- Incoming material
- Work methods
- Operator training
- Measurement systems
- Environmental conditions
In manufacturing, these possibilities are often organized using the 6M categories: Manpower, Machine, Method, Material, Measurement, and Mother Nature.
The diagram gives the team a structured way to capture ideas without immediately settling on one explanation.
However, a possible cause on the diagram is only a hypothesis. The team still needs production data, measurements, records, or observations to determine whether it actually contributed to the problem.
For a detailed explanation, see our guide to the Ishikawa Fishbone Diagram.
Can You Use 5 Whys and Fishbone Together?
Yes. The two methods can work well as part of the same investigation.
A team can first use a Fishbone Diagram to capture the different factors that could have contributed to a problem. After checking those possibilities against available evidence, the team can use 5 Whys to investigate a specific cause in greater depth.
For example, a team investigating defective parts might identify possible causes related to the machine, material, method, and measurement.
If production data points to a machine-setting problem, the team can then use 5 Whys to investigate why the setting was wrong and why the process did not catch the issue earlier.
The workflow could look like this:

The value of combining the methods is that you can explore the problem broadly before investigating a specific cause in more detail.
Don't Stop at the First Plausible Cause
Finding an explanation is not the same as proving it is the root cause.
For example, saying "operator error" may describe what happened, but it does not explain why the process allowed the error to happen.
Was the work instruction unclear? Was the operator properly trained? Was the right information available at the workstation? Could the process have prevented or detected the mistake?
These questions shift the investigation from the immediate event to the conditions that allowed it to occur.
A useful root cause should be supported by evidence and lead to a corrective action that addresses the underlying problem.
Which Should You Use?
If you already have a likely cause and can follow the evidence, start with 5 Whys. If the cause is unclear or you need to examine several possibilities, start with a Fishbone Diagram. If you need to explore several possibilities and then investigate one in depth, use both.
Whichever method you choose, base the investigation on evidence rather than assumptions.
Start Your Root Cause Analysis
Once you know which approach fits the problem, the next step is to put it into practice. Use our 5 Whys template to work through a specific cause step by step, or use the Fishbone Diagram template to map out possible causes with your team.
Back Your Root Cause Analysis With Real Data
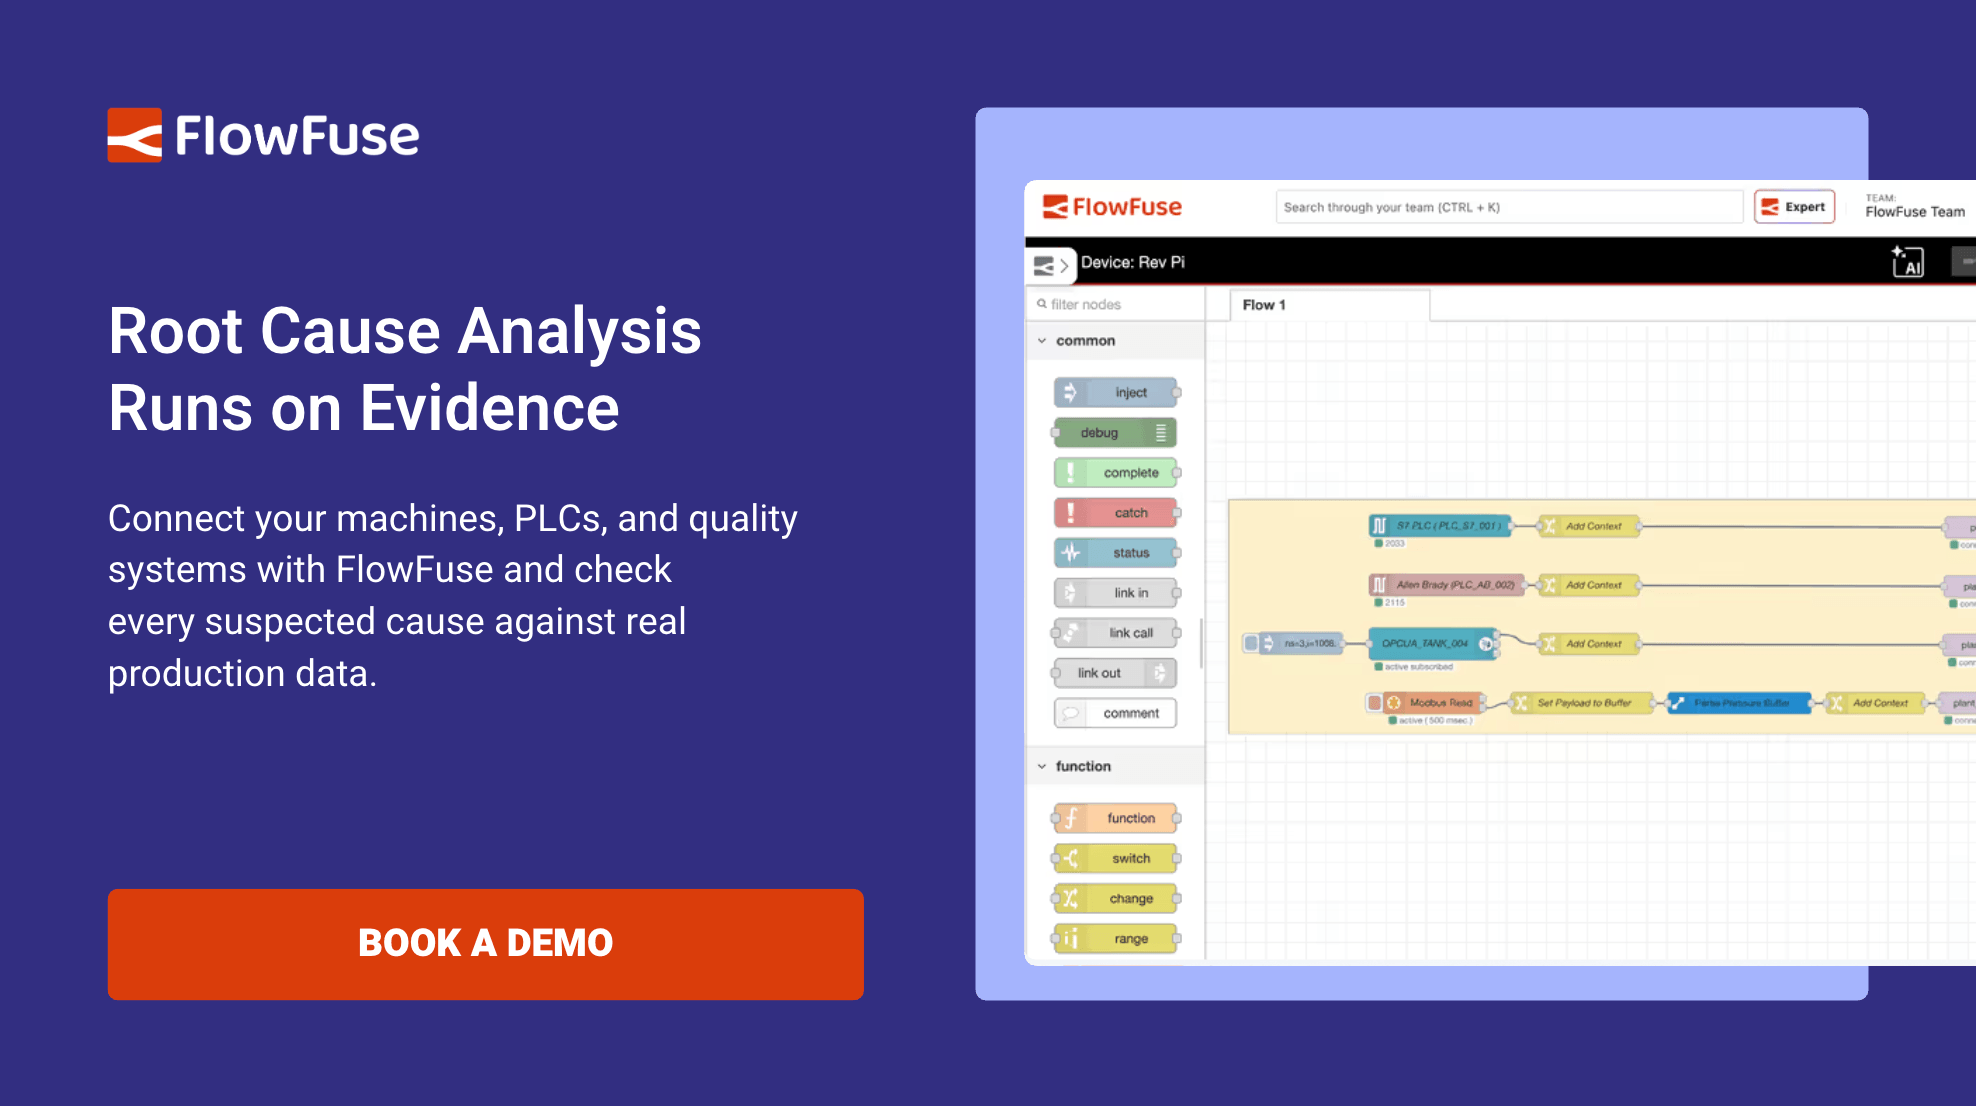
See how FlowFuse connects machines, PLCs, and quality systems so your team can check suspected causes against production data instead of assumptions.
Frequently Asked Questions
About the Author
Sumit Shinde
Technical Writer
Sumit Shinde is a Technical Writer at FlowFuse specializing in industrial automation and manufacturing. In the past three years, he has built industrial applications and authored more than 100 technical articles covering industrial connectivity, unified data architecture, production metrics, and quality management for modern manufacturing.
Like what you're reading?
Add FlowFuse as a preferred sourceOn the page that opens, check the box next to flowfuse.com to see more of our articles in your Google Search results.
Related Articles:
- A Control Plan Template Your Shop Floor Will Actually Use
- End of Line Testing: Your Final Defense Against Defects
- Quality Assurance vs Quality Control: Fixing the Process or Checking the Product
- Buyer's Guide: How to Evaluate an Edge AI Platform for Industrial Use
- CQI-9 Heat Treat Audit: A Drifting Thermocouple Can Fail the Whole Furnace