Fishbone Diagram Template: Free Download
Download a free fishbone diagram template for sorting causes into categories during a root cause analysis.

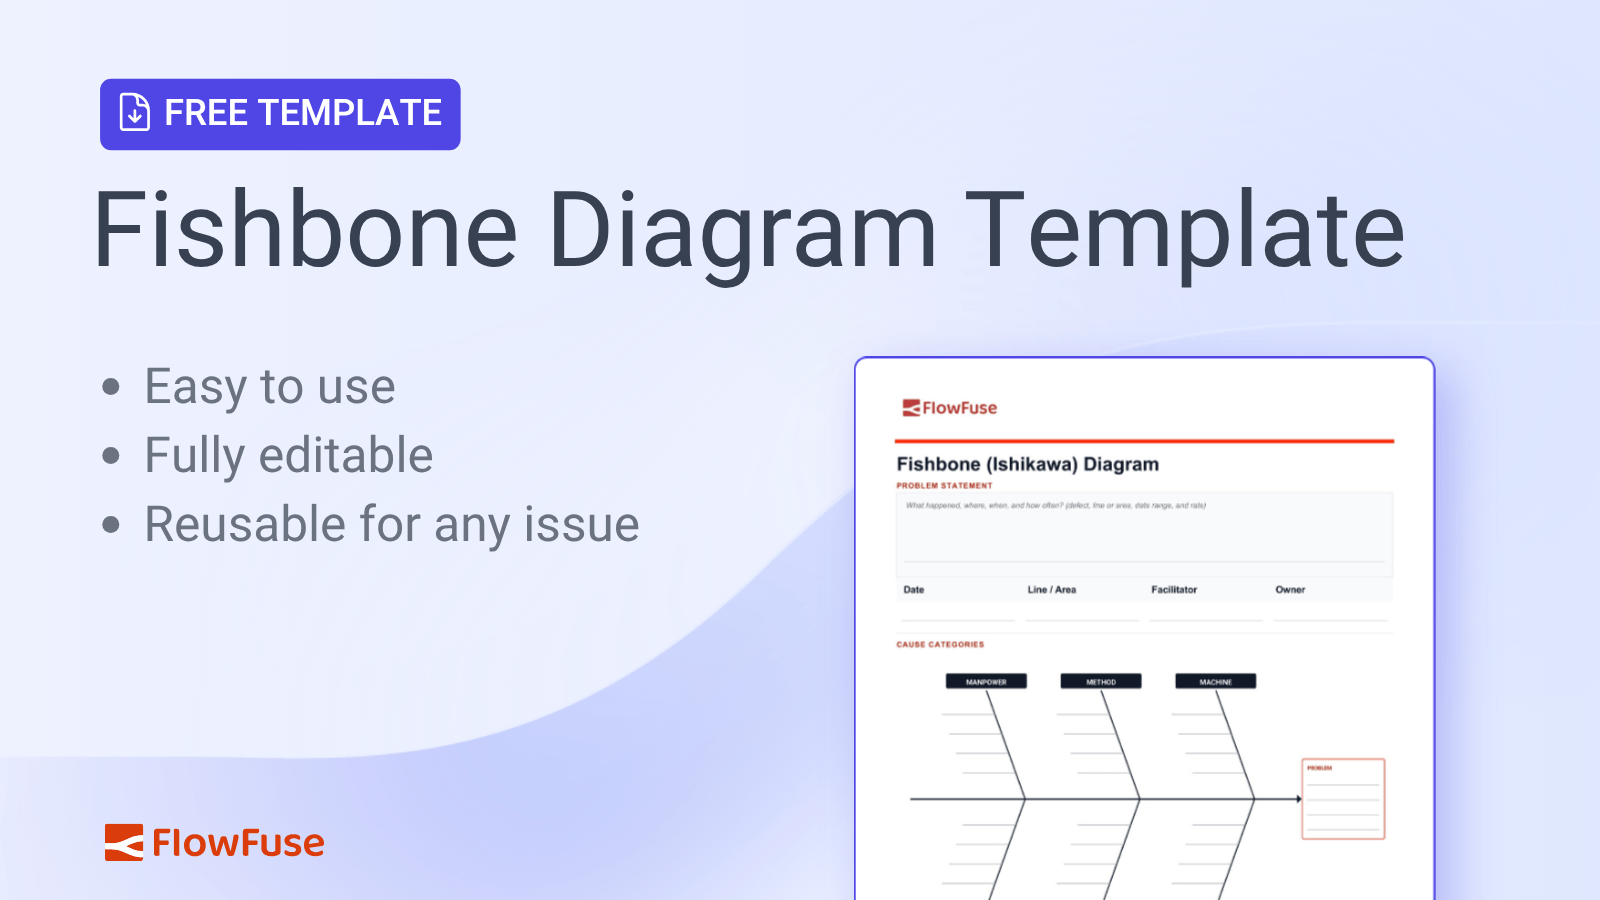
Download a free fishbone (Ishikawa) diagram template to sort possible causes into categories, then verify the top suspects with data.
A fishbone diagram template gives your team a fish shape to draw on instead of a blank whiteboard, so the session starts with brainstorming instead of formatting.
Unlike a 5 Whys template, which documents one causal chain going deep, a fishbone template holds several categories side by side going wide. That shape is the whole point: it's built for the moment you don't yet know where a problem lives. If you're not sure which method fits your problem, see 5 Whys vs. fishbone diagram.
Download the free template below and use it the next time your team needs to brainstorm causes across categories, not drill into one.
Fishbone Diagram Parts
A fishbone template is really just four zones, each doing a different job:
- The head: a single problem statement, specific enough that "what happened, where, and how often" are all answered in one sentence.
- The spine: the line running into the head. It doesn't hold information, it just gives the ribs somewhere to attach.
- The ribs: four to six categories branching off the spine. The 6Ms (Manpower, Method, Machine, Material, Measurement, Mother Nature) are the manufacturing default, not a requirement, rename or drop any that don't match your process.
- The branches: the specific, checkable causes hanging off each rib, plus a note on which ones you later verified against data.
An empty rib isn't a gap to fill. It means that category doesn't apply to this problem, and forcing entries into it just to fill the space adds noise, not signal.
How to Fill Out the Template
The most common way teams misuse the template is drilling into the first plausible cause the moment someone suggests it. That collapses a breadth tool into a narrow one before it's done its job.
Work one rib at a time and exhaust it before moving to the next: everything Machine-related, then everything Material-related, and so on. Only once every rib has been brainstormed should the team circle the two or three strongest branches and hand those to a depth tool like the 5 Whys.
Vague branches defeat the exercise just as fast as skipping ribs does:
| Avoid | Better |
|---|---|
| Machine issue | Print head height drifted out of spec last week |
| Bad material | New ink supplier introduced two weeks ago |
| Training | Night shift not trained on the new ink's dry time |
A branch should be specific and testable, not a category name repeated back as if it were an answer.
Example
A packaging line is rejecting cartons because the printed date code is smearing, that's the head. Working rib by rib, the team notes a drifted print head under Machine, a new ink supplier under Material, an unwritten cleaning interval under Method, and rising plant humidity since an HVAC repair under Mother Nature. No single rib explains it alone.
Two branches stand out once all six are filled: the new ink and the humidity shift. Those are the ones worth verifying against a log or measurement, not whichever one came up first.
Using the Template for Different Problems
The categories on this template are meant to be edited, not treated as fixed. A service outage will need ribs that look nothing like a factory floor's, and that's expected. What should stay constant across every use is the shape: a specific head, ribs that actually apply, and branches specific enough to check against real data rather than restating the category they sit under.
Verify Which Suspected Cause Is Real
See how FlowFuse connects PLCs, sensors, and quality systems so your team can test which cause on the fishbone is real, using live production data.
About the Author
Sumit Shinde
Technical Writer
Sumit Shinde is a Technical Writer at FlowFuse specializing in industrial automation and manufacturing. In the past three years, he has built industrial applications and authored more than 100 technical articles covering industrial connectivity, unified data architecture, production metrics, and quality management for modern manufacturing.
Like what you're reading?
Add FlowFuse as a preferred sourceOn the page that opens, check the box next to flowfuse.com to see more of our articles in your Google Search results.
Related Articles:
- CQI-9 Heat Treat Audit: A Drifting Thermocouple Can Fail the Whole Furnace
- PPAP Checklist: Free Template and How to Review a Submission
- Manufacturing Defects: One Weld Crack, Four Ways to Classify It
- Automotive Quality Control 101: Lessons From a 470,000-Vehicle Recall
- Automotive ERP: Integrating with Shop-Floor Systems