Blog
-
Building a Custom Video Player in Dashboard 2.0
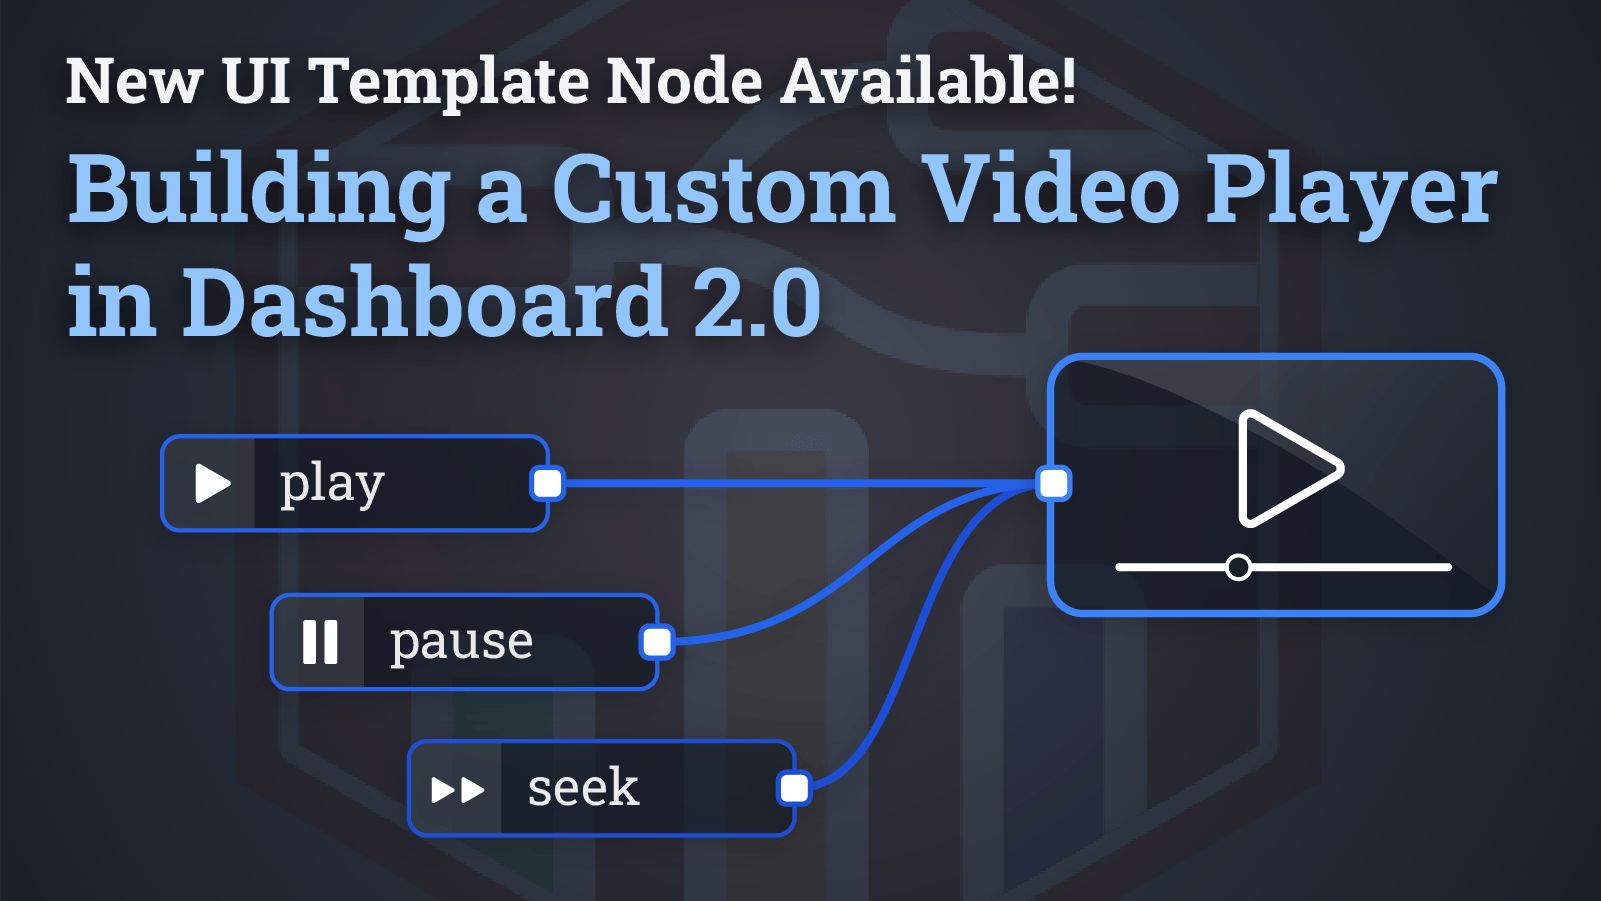
Dashboard 2.0 just got a lot more powerful with our new updates to the ui-template node. New features added to the node include: Support for a full Vue component to be defined using the VueJS Options API.
Running of raw JavaScript within <script /> tags Loading of external dependencies through <script /> tags
read more... -
Overhauling the Dashboard 2.0 Build Pipeline
Explore the latest updates in Dashboard 2.0 with the 0.8.0 release, featuring an overhauled build pipeline, improved debugging capabilities, and more. -

Tracking Who Has Opened a Dashboard
Learn how to track user visits to your Node-RED Dashboard v2 using FlowFuse Authentication. Secure access and identify users accessing your dashboard with this implementation. -
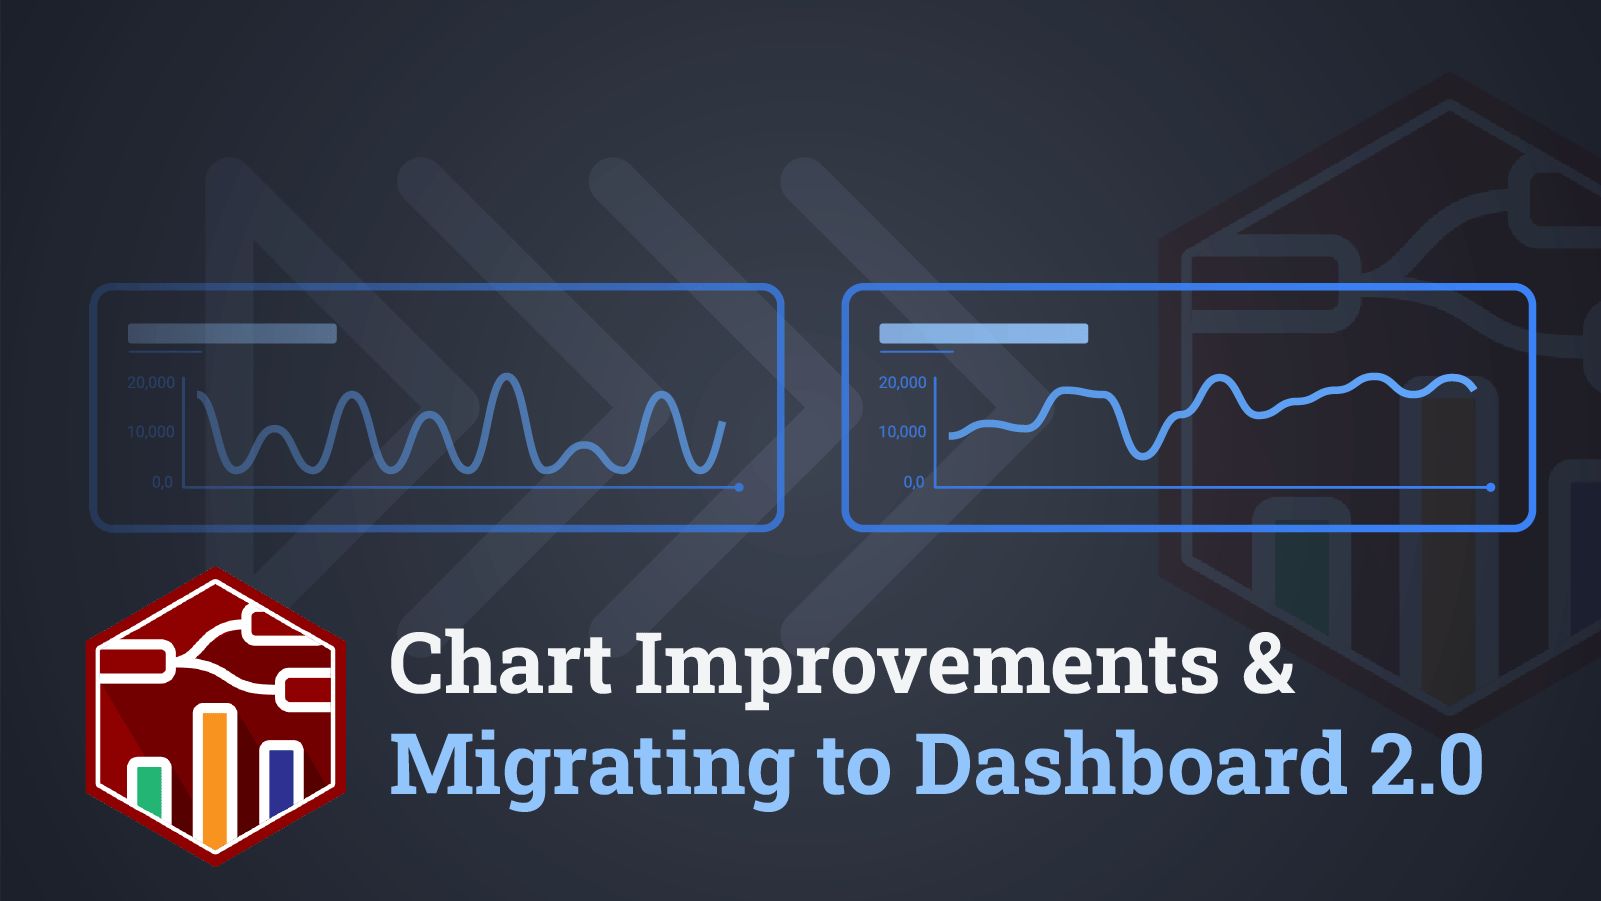
Chart Improvements & Migrating to Dashboard 2.0
Discover significant chart enhancements and migration guidance in Dashboard 2.0's 0.7.x releases. Stay informed on project updates. -
Integrate your own widgets with Dashboard 2.0
Explore Dashboard 2.0's 0.6.0 Release with third-party widget support. Learn more, build your widgets, and join our community on GitHub. -
Custom Vuetify components for Dashboard 2.0
Expand your dashboard with the full collection of Vuetify components -
Dynamic Markdown, Tables & Notebooks with Dashboard 2.0
Explore the latest features in Dashboard 2.0's v0.4.0 release, including "Notebook" layout, dynamic Markdown & Table widgets, and additional enhancements. -
Dashboard 2.0 - Community Update
Our latest Community Update for Dashboard 2.0, including the latest new widgets, fixes and updates on what's next. -
First Pre-Alpha Release of the new Node-RED Dashboard
The first release of the successor to the Node-RED Dashboard has arrived, marking the beginning of the pre-alpha phase. -
How to add images to Node-RED dashboards when using FlowFuse
Learn to enhance Node-RED dashboards with images using FlowFuse. Pull images from URLs, store locally, and serve them in your dashboards. -
The Next Step in Data Visualization - Announcing the Successor to the Node-RED Dashboard
This article unveils FlowFuse's plans to build the successor to the Node-RED Dashboard. -
Node-RED Tips - Dashboard Edition
Learn three practical tips for improving your Node-RED Dashboard workflow, such as creating responsive layouts, adding multiple data series to charts, and persisting slider values. -
Persisting chart data in Node-RED Dashboard 1
Chart data in Node-RED can be stored directly in your flows but it's a good idea to also store data eleswhere. In this article we are looking at some easy ways to persist your historic chart data in Dashboard 1 -
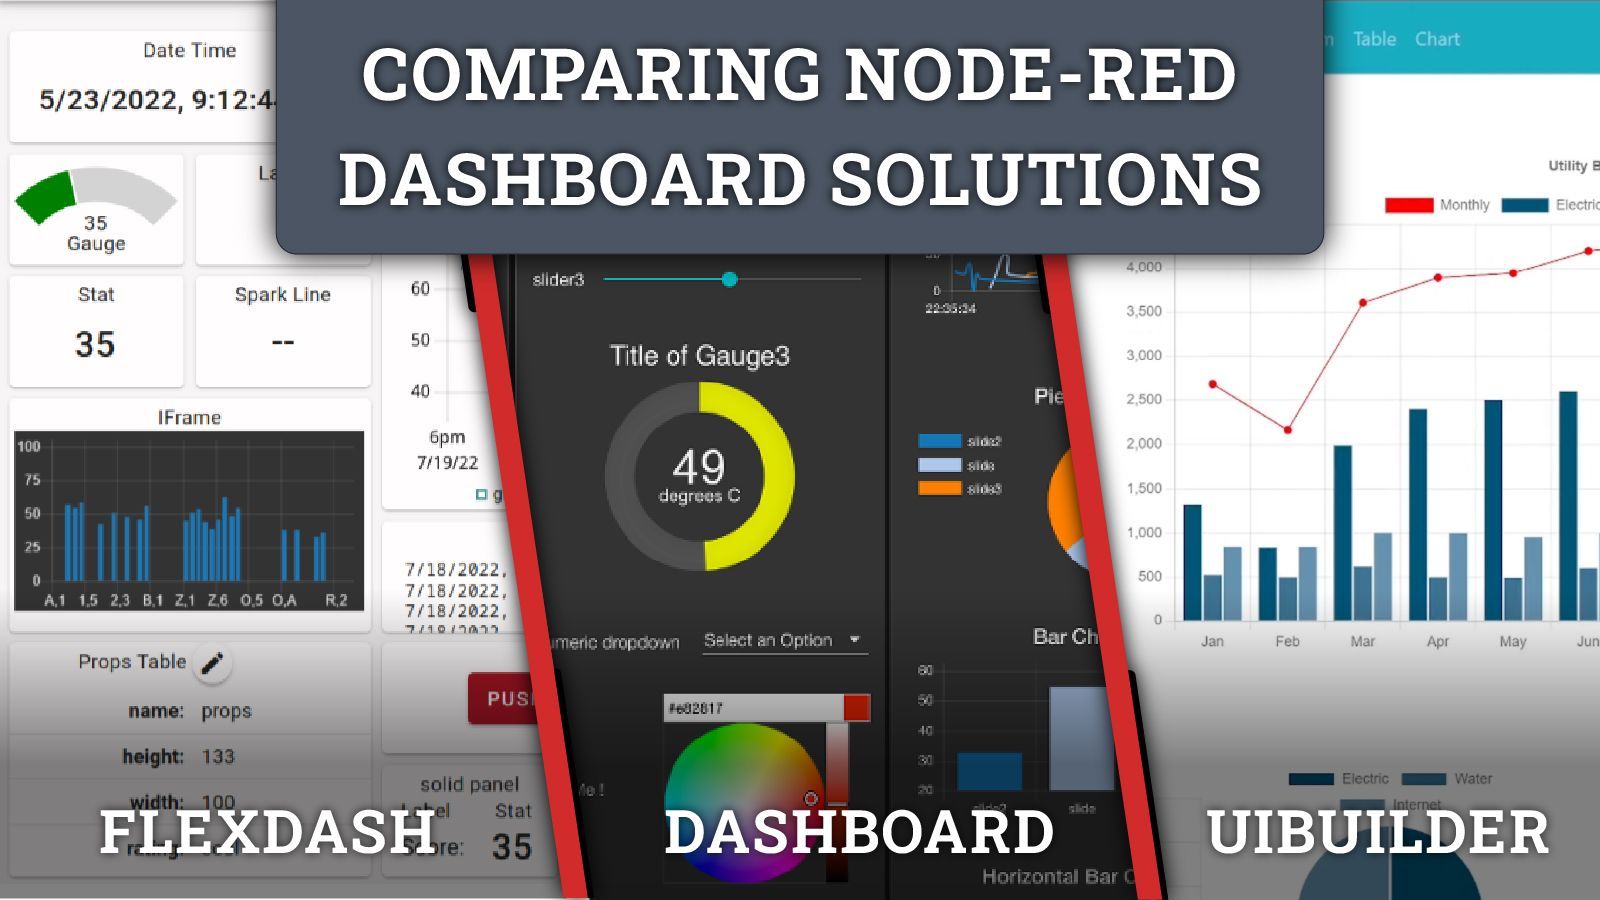
Comparing Node-RED Dashboards Solutions
Explore a thorough comparison of Node-RED dashboard solutions, covering installation, UI elements, support, and future development plans.