Overhauling the Dashboard 2.0 Build Pipeline
A month or so ago, we released the Third-Party widget support for Dashboard 2.0, but having seen the feedback, we missed the beat, so we've built it again!
As a developer, sometimes you have to hold up your hands and realise something you've spent two weeks building needs to be thrown away and restarted.
Having shipped the third-party widget support for Dashboard 2.0 in line with Dashboard 1.0's approach, we then had the feedback that the way Dashboard 1.0 did things really wasn't good, and asking us to consider re-building the process to make the developer experience of working with Dashboard 2.0 far more seamless.
So, that's exactly what we've done with the 0.8.0 release, amongst a few other things.
@flowfuse namespace, so you'll need to update to use @flowfuse/node-red-dashboard, and not @flowforge.Migrating our Build Pipeline
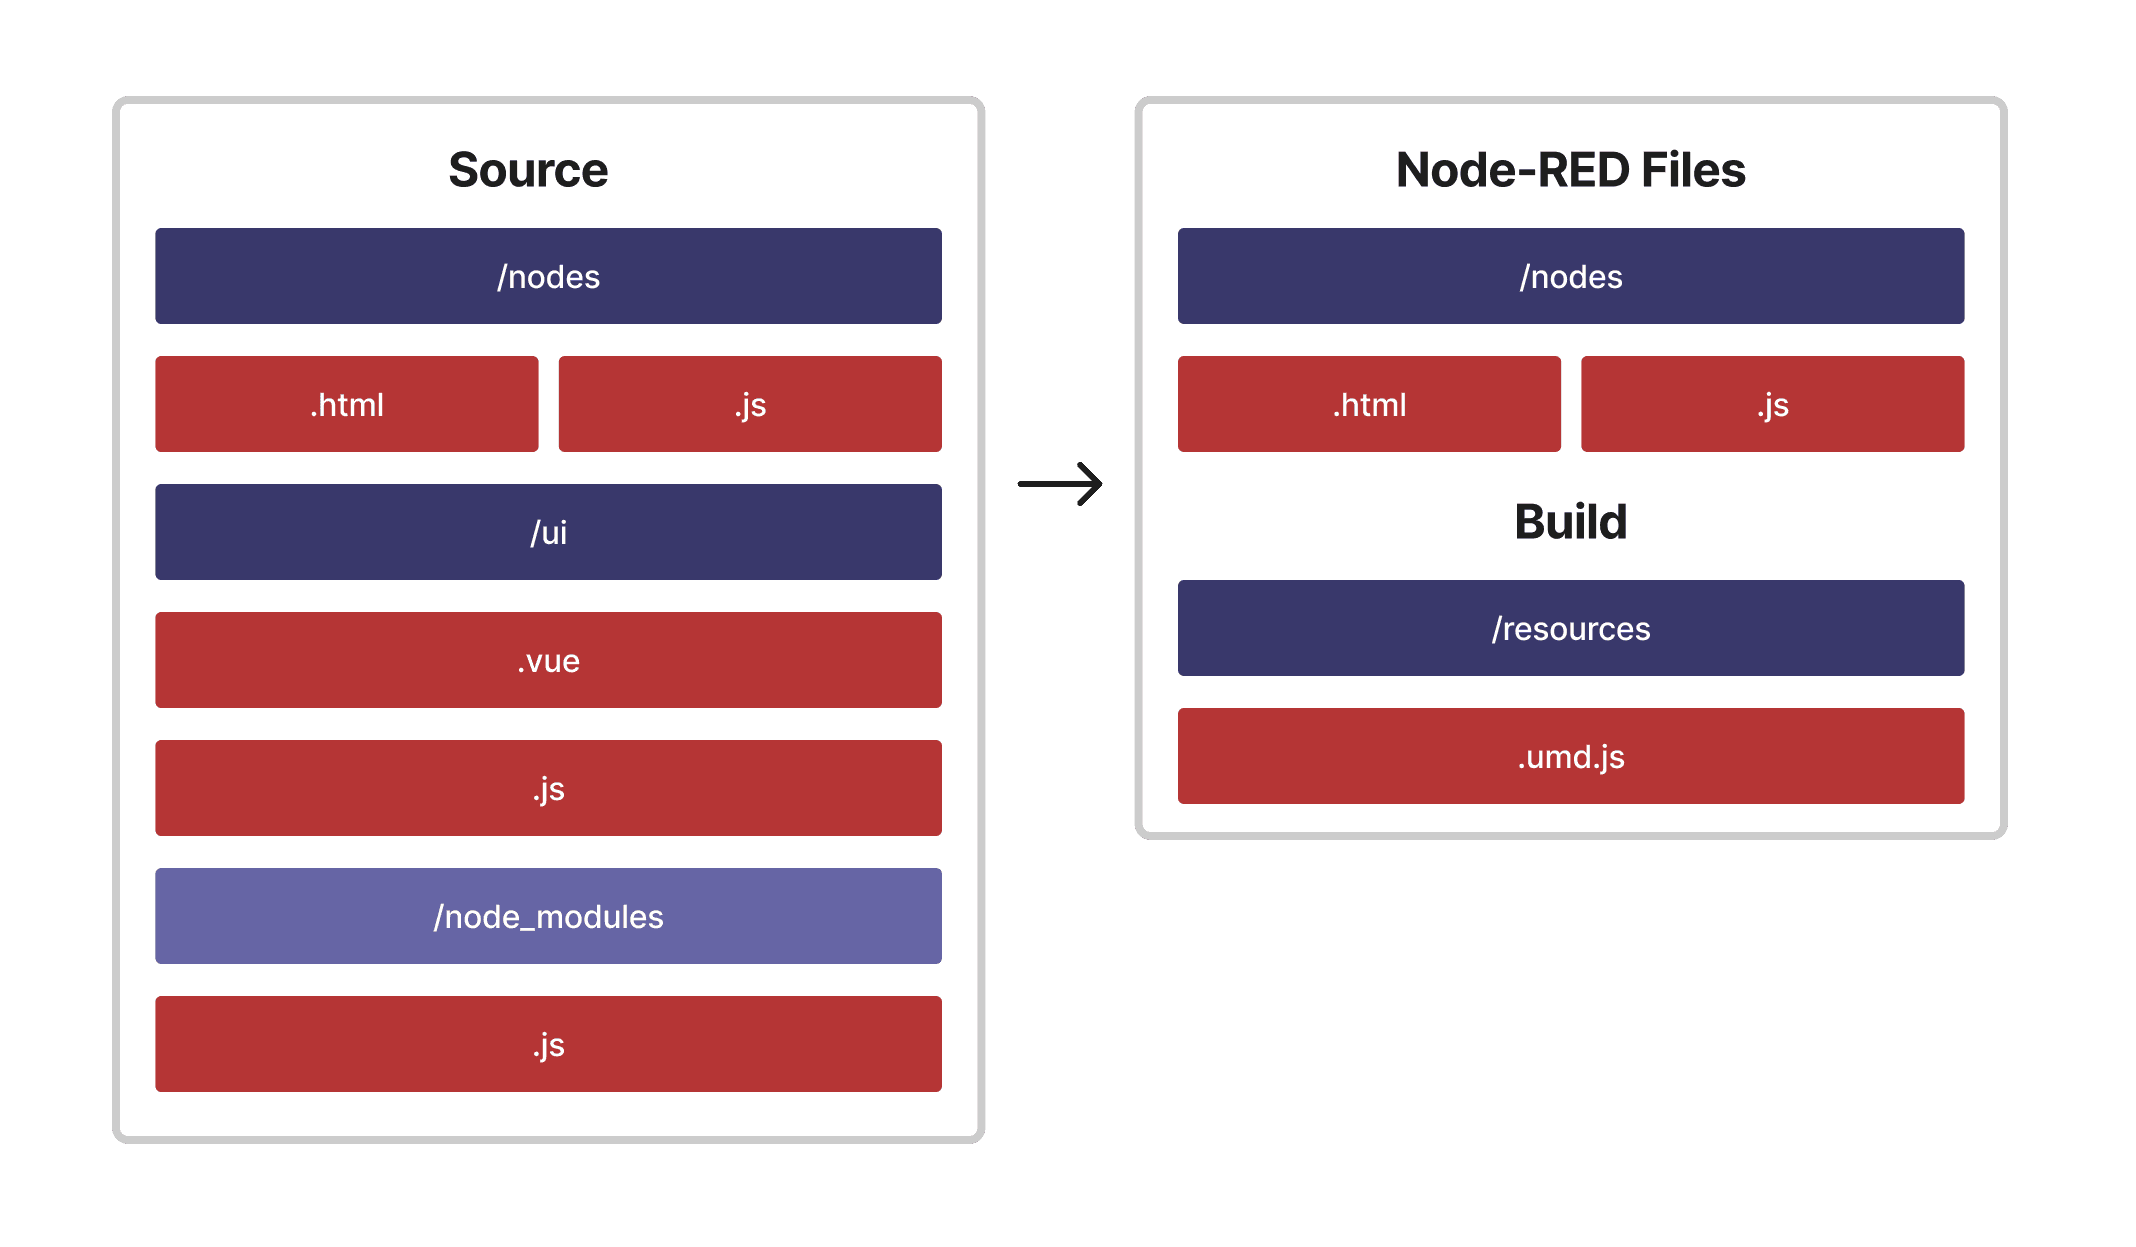
Without getting too technical, as part of this work in supporting third-party widgets, we overhauled our build pipeline for Dashboard 2.0. This pipeline is responsible for taking our source code, and compiling it into a format that then gets deployed by Node-RED when running Dashboard.
Previously, we used Webpack, but now, we've switched over to Vite. This is a newer build tool, and is much faster than Webpack. It's also what we've now updated out Example Node to use too.
So now, when working with a third-party widget, Vite builds up all of your code, wraps it into a single umd.js file, and Node-RED then serves that file up for Dashboard 2.0 to load in.
We've also re-written our "Building Third Party Widgets" guide to reflect this change.
Debugging Dashboard
A new feature we've added in 0.8.0 is also for those developing Dashboard's core and third-party widgets. You can now navigate to /dashboard/_debug to explore the full configuration that Dashboard receives from Node-RED.
This is particularly useful when you're trying to debug why a widget isn't loading, showing the correct data, or generally isn't behaving as you expect.
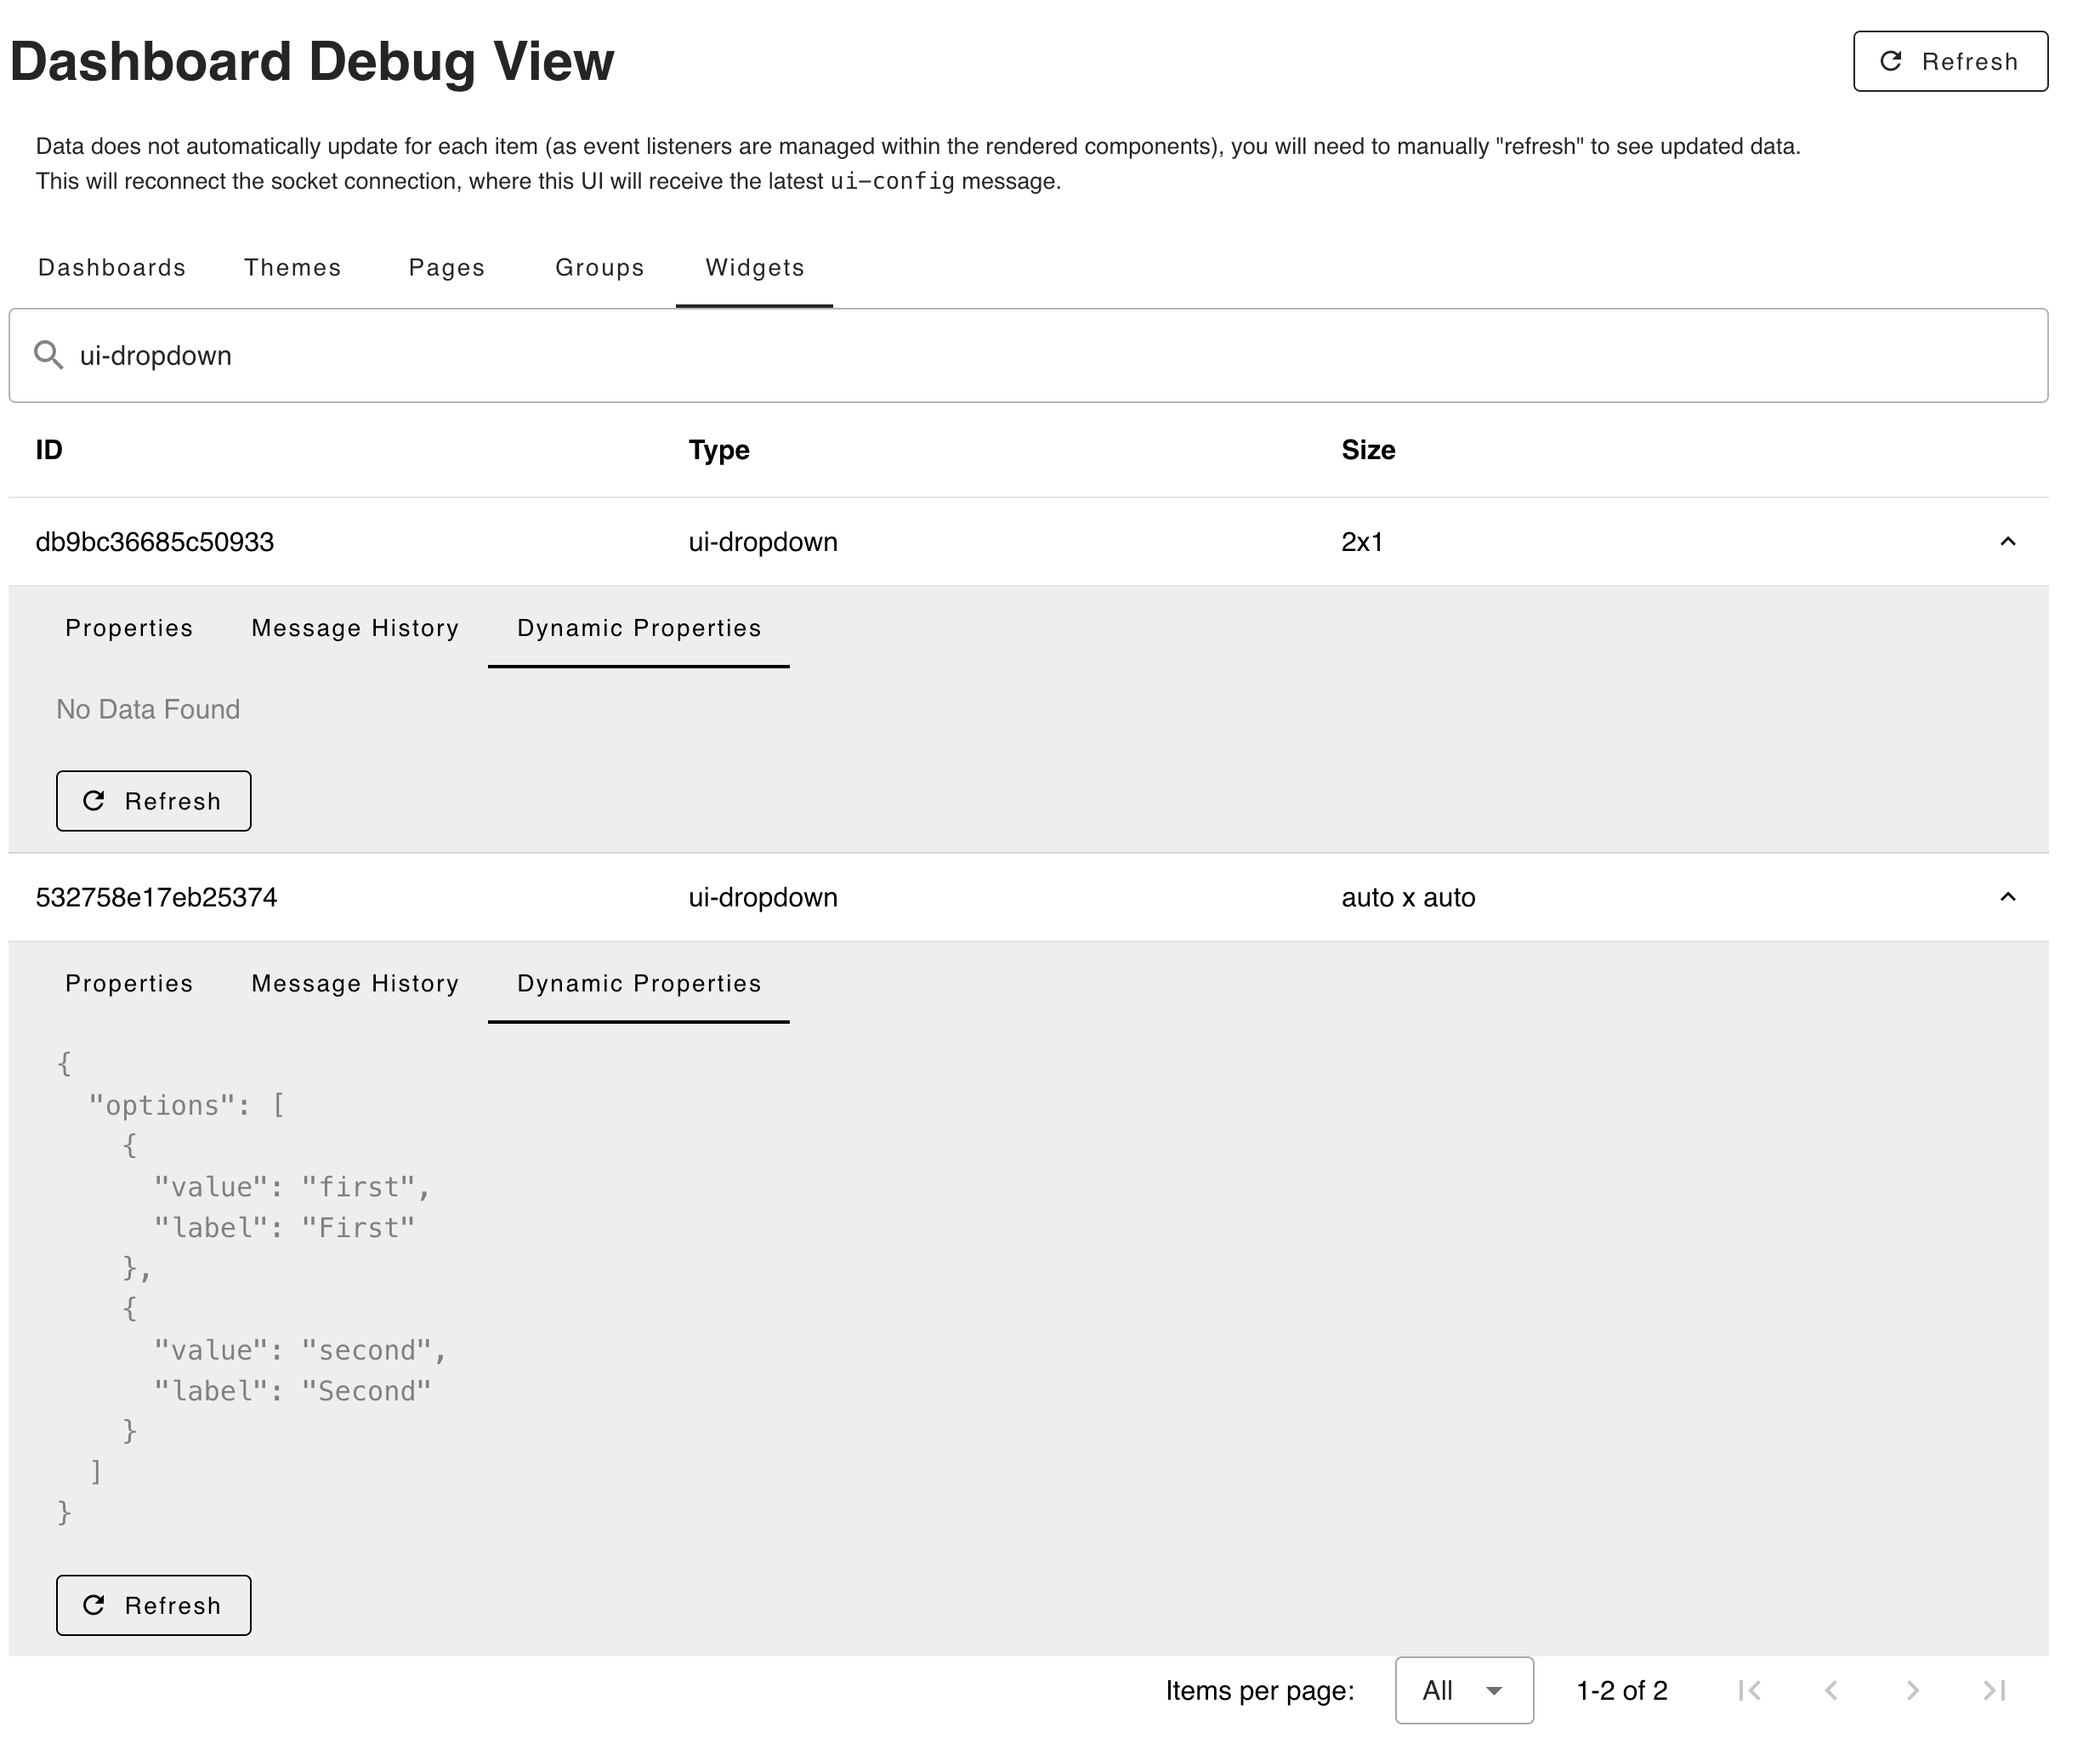
Note in the above example, where we can see that the ui-dropdown has had it's options overriden by msg.options on injection.
You can read more about the debugging view here
What else is new in 0.8.0?
Whilst we focussed this article on the build pipeline overhaul, changes to third-party wdgets and debugging Dashboard, we did also squeeze quite a lot more into the 0.8.0 releases too with plenty other fixes and improvements:
- Dynamic setting of msg.options for UI Dropdown
- "Date" type for UI Text Input
- Finer grain controls of Text Input event emissions
- Control over when UI Slider emits events
- Improved documentation for Bar Charts
You can also read the more comprehensive release notes for the release here:
Follow our Progress
As always, thanks for reading and your interested in Dashboard 2.0. If you have any feature requests, bugs/complaints or general feedback, please do reach out, and raise issues on our relevant GitHub repository.
Discuss your use case with our team
See how FlowFuse can support your architecture, integrations, and deployment needs.
About the Author
Joe Pavitt
Joe has been working with Node-RED for nearly 10 years, having worked with Nick O'Leary at IBM as a Master Inventor, and been one of the early developers working on the original Node-RED Dashboard. Since joining FlowFuse in 2022, Joe has become the lead for the FlowFuse Dashboard (Dashboard 2.0), created the Node-RED Academy and leads design and front-end development for FlowFuse.
Table of Contents
Like what you’re reading?
Add FlowFuse as a preferred sourceOn the page that opens, check the box next to flowfuse.com to see more of our articles in your Google Search results.