Blog
-
What is 5S Checklist: Definition, Benefits, Implementation, and Template
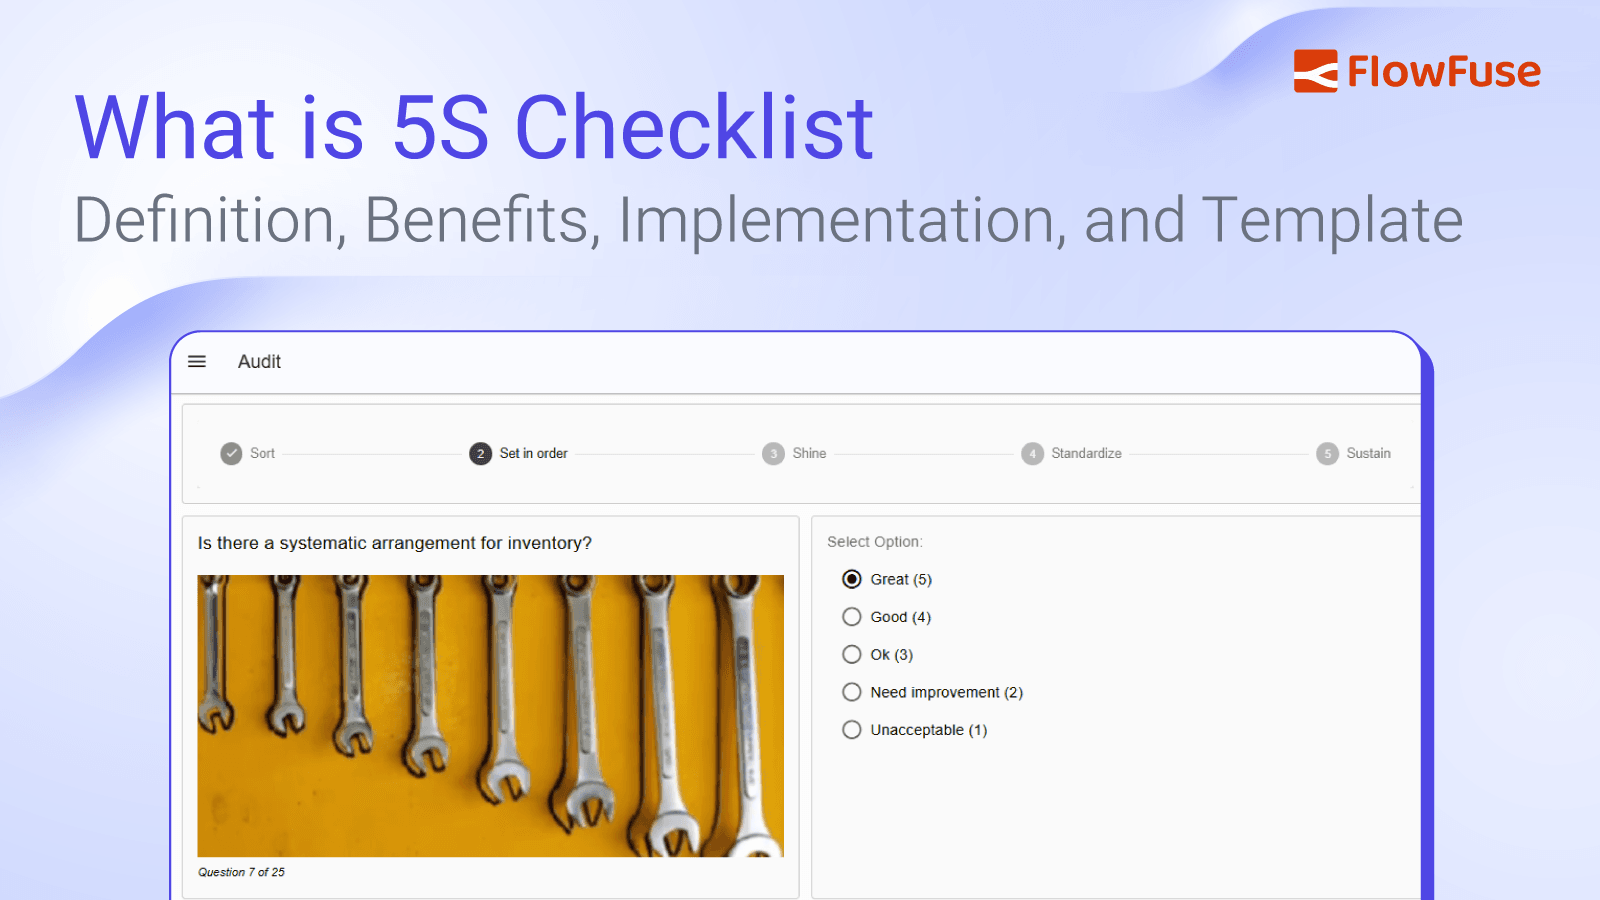
Manufacturing environments face increasing pressure to eliminate waste, improve safety, and maintain quality standards. Disorganized workspaces contribute to production delays, safety incidents, and quality defects that directly impact operational performance. The 5S methodology addresses these challenges through systematic work area organization, but implementation requires consistent evaluation and measurement. A 5S checklist provides the structured framework necessary to assess, maintain, and improve work area organization standards across manufacturing operations.
read more... -
Sign up for our monthly email updates:
-
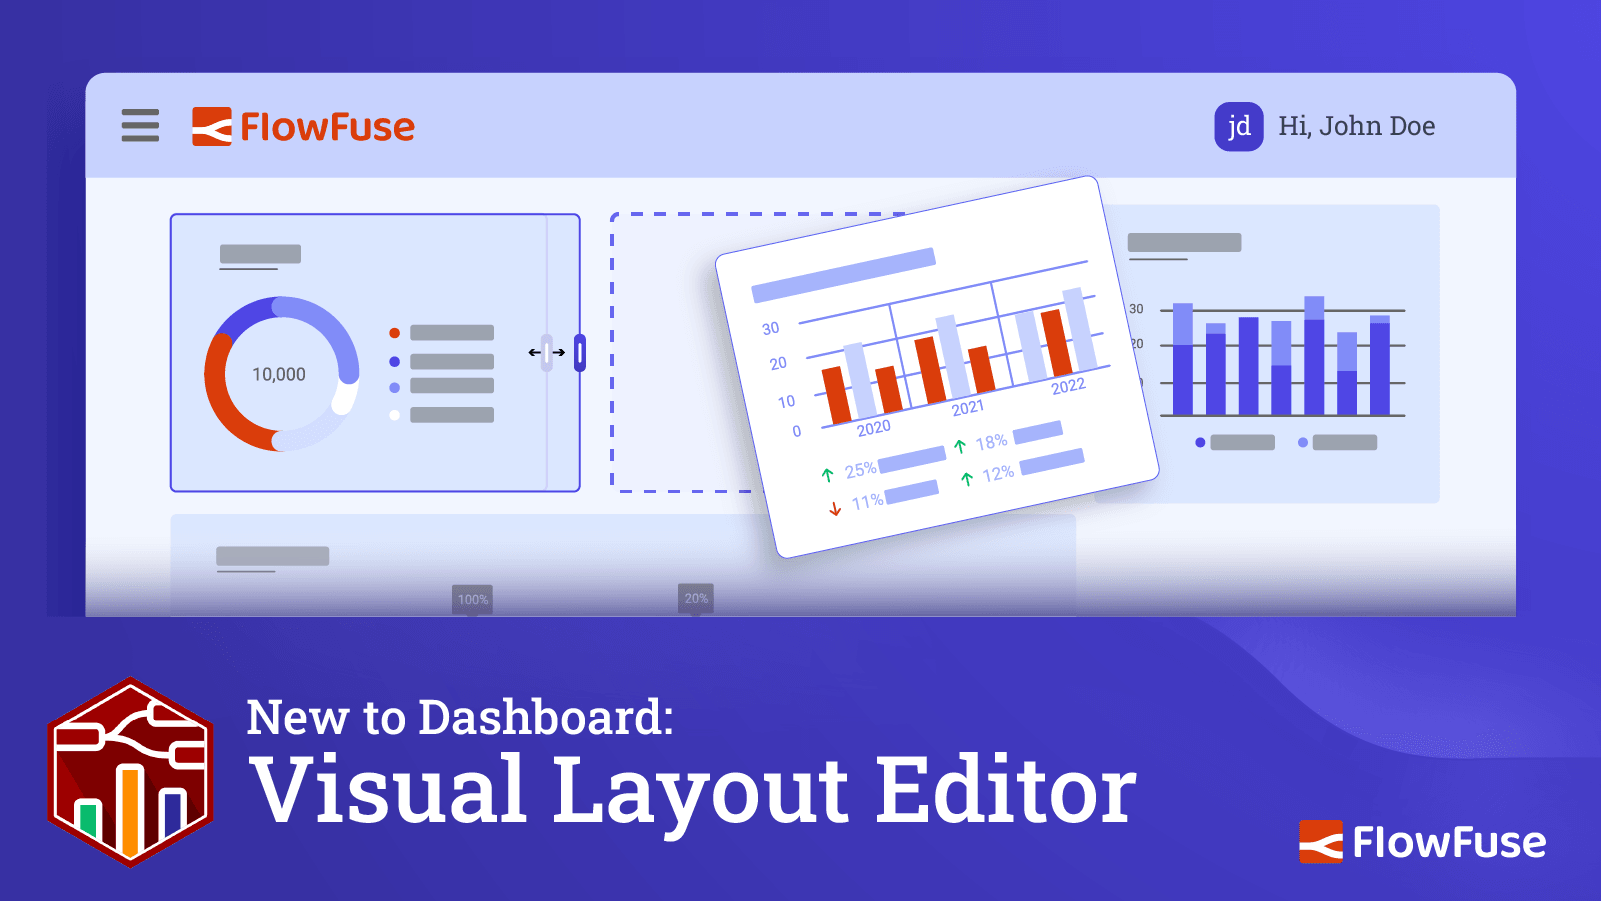
Visual Layout Editor - Now Available in Dashboard
It has been one of the most requested features for FlowFuse Dashboard, and is now available in its first iteration.... -
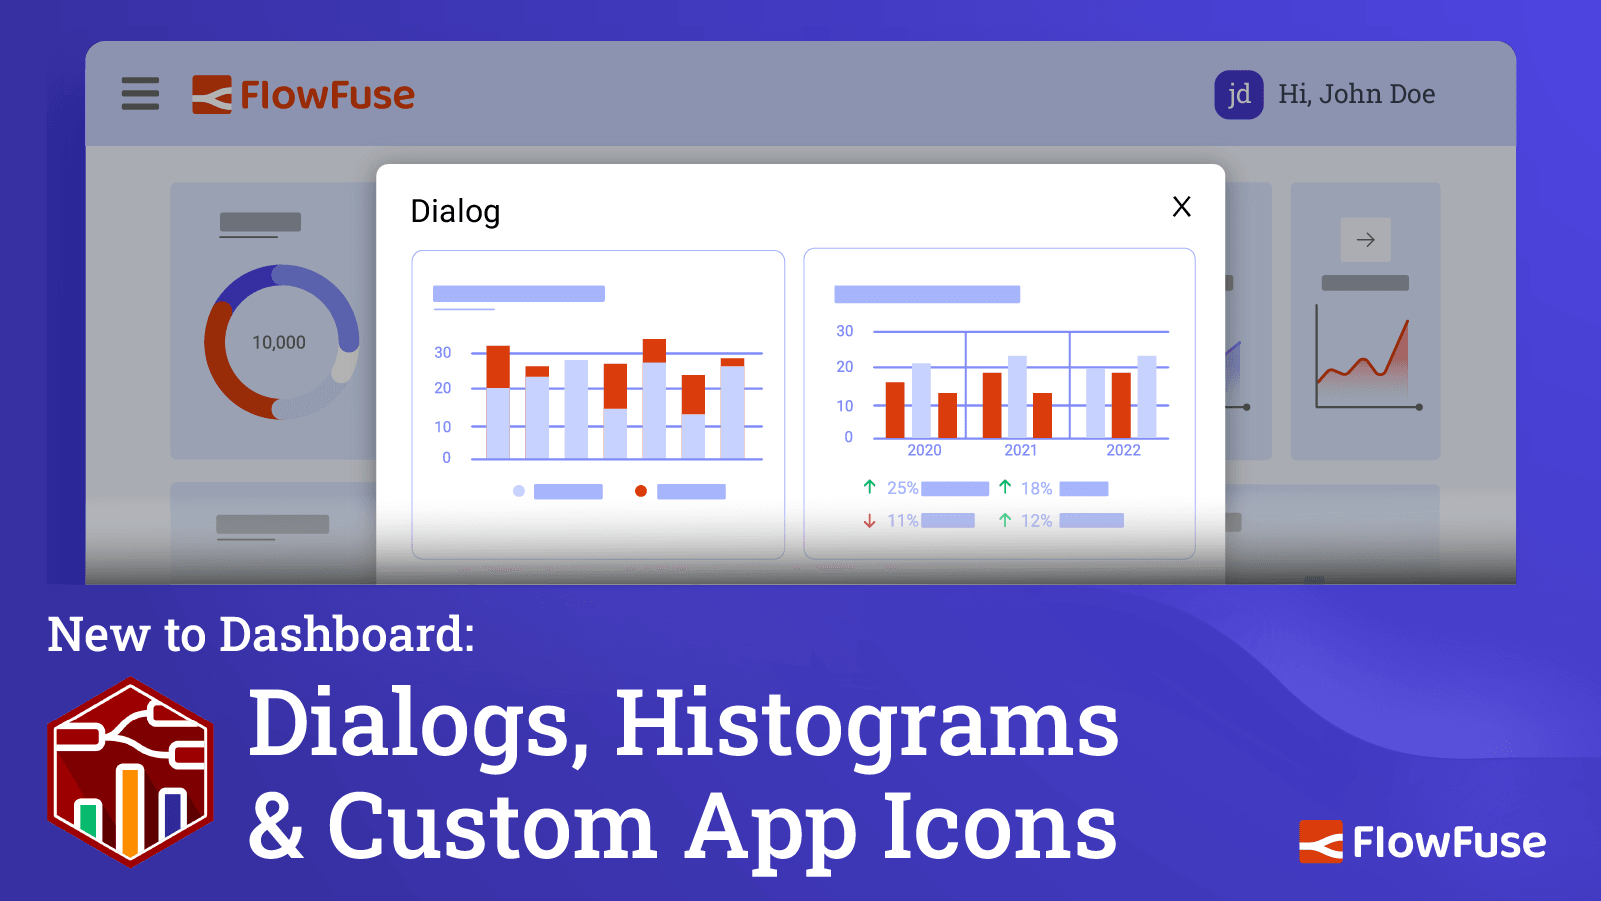
Dialogs, Customizable Icons and Histograms Now Available in FlowFuse Dashboard
This update introduces new ways to enhance data visualization and customization in your dashboards. With key improvements, including a new... -
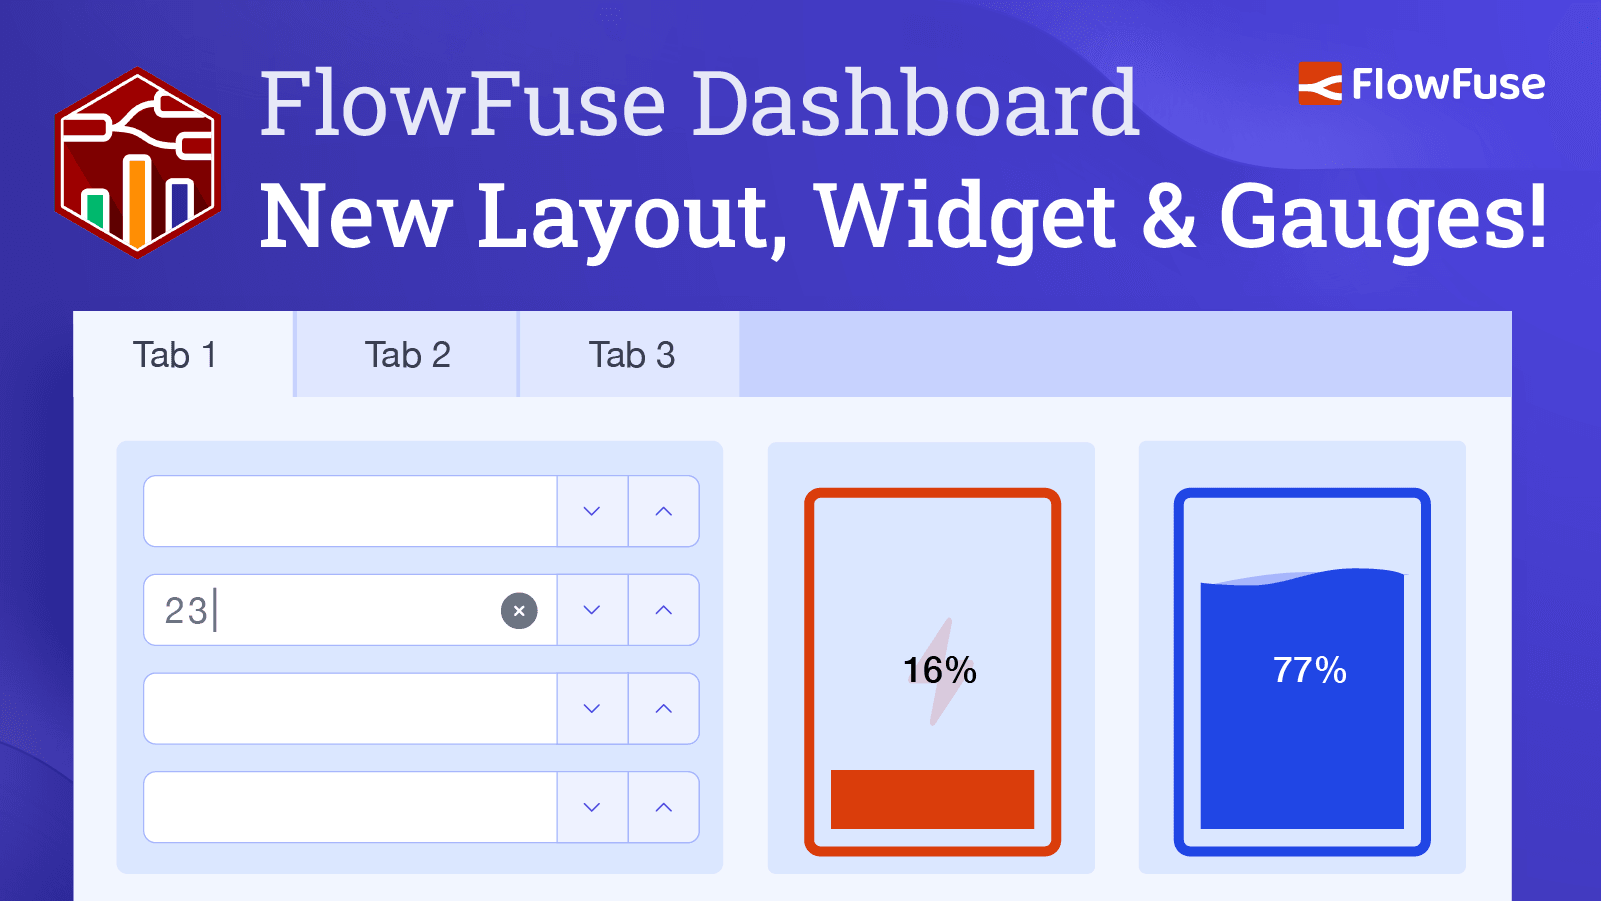
New Layout, Widget and Gauges Now Available in FlowFuse Dashboard
At FlowFuse, we're constantly evolving to make sure your dashboard experience is seamless and efficient. This month, we're excited to... -
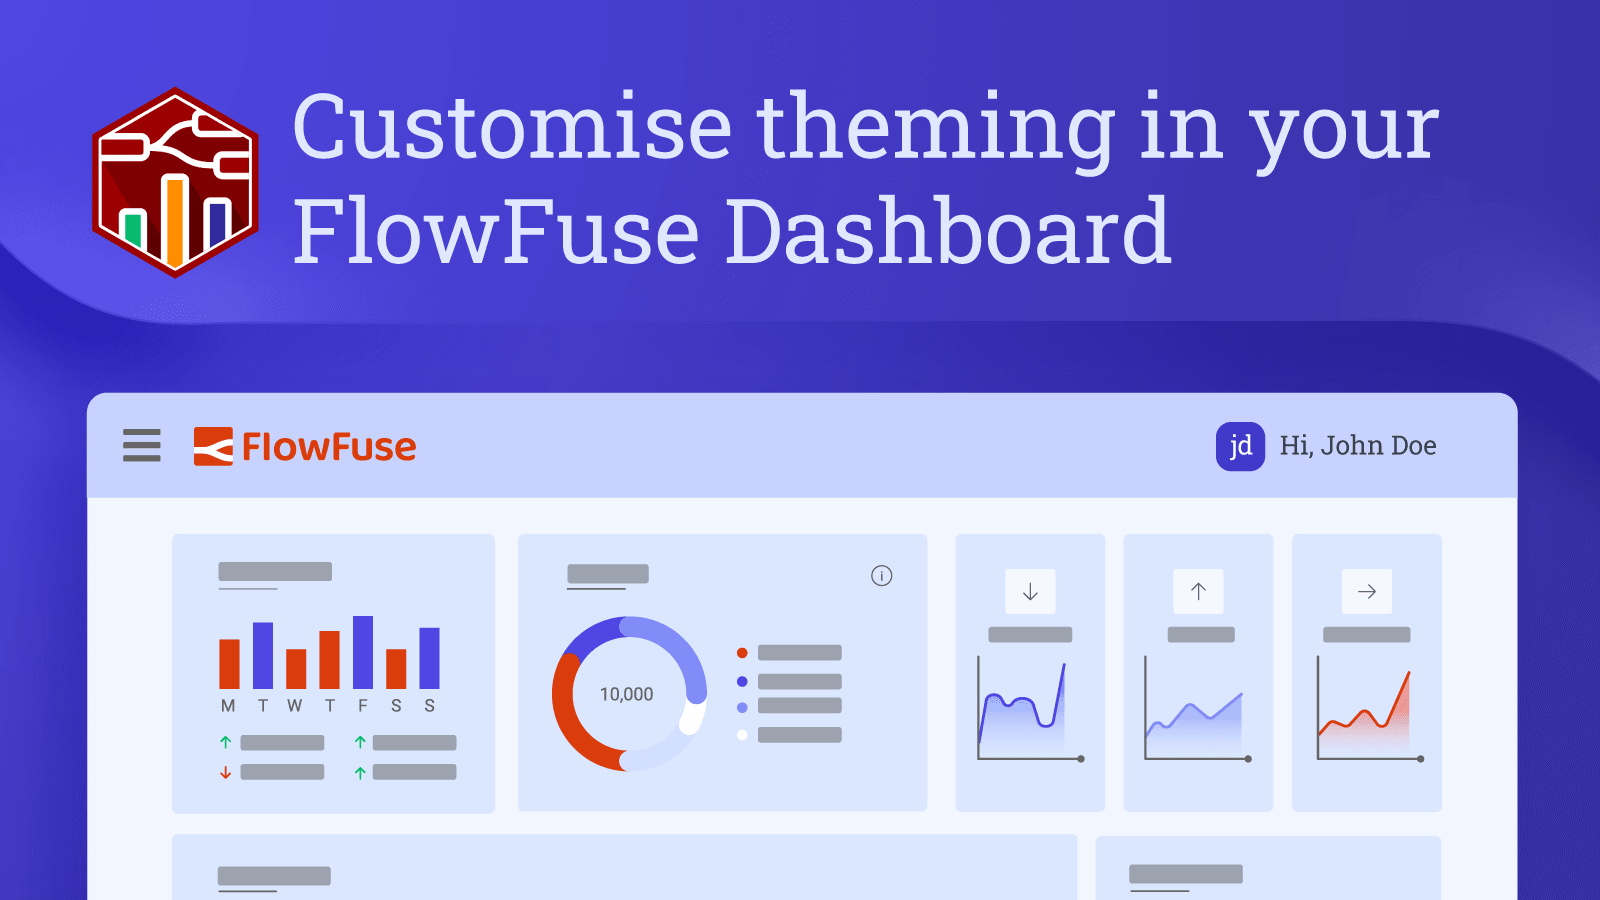
Customise theming in your FlowFuse Dashboard (2026)
A recent release of FlowFuse Dashboard (Dashboard 2.0) has taken customization to the next level. -
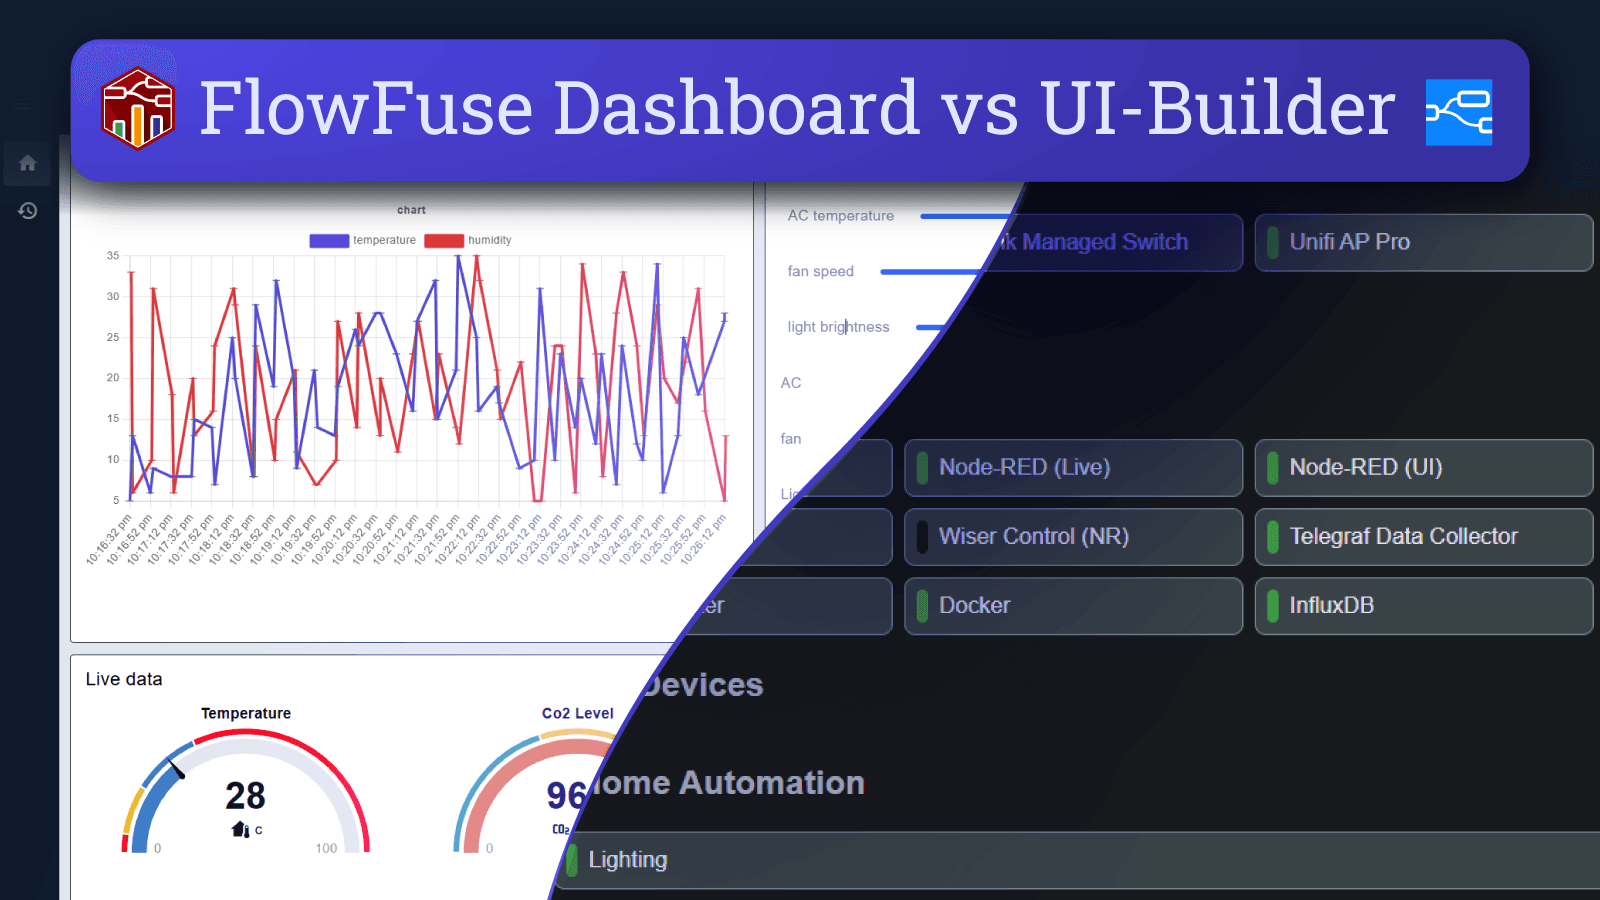
FlowFuse Dashboard vs UI-Builder: A Comprehensive Comparison
When choosing a dashboard solution for Node-RED, two popular options are FlowFuse Dashboard (also known as Dashboard 2.0) and UI-Builder.... -
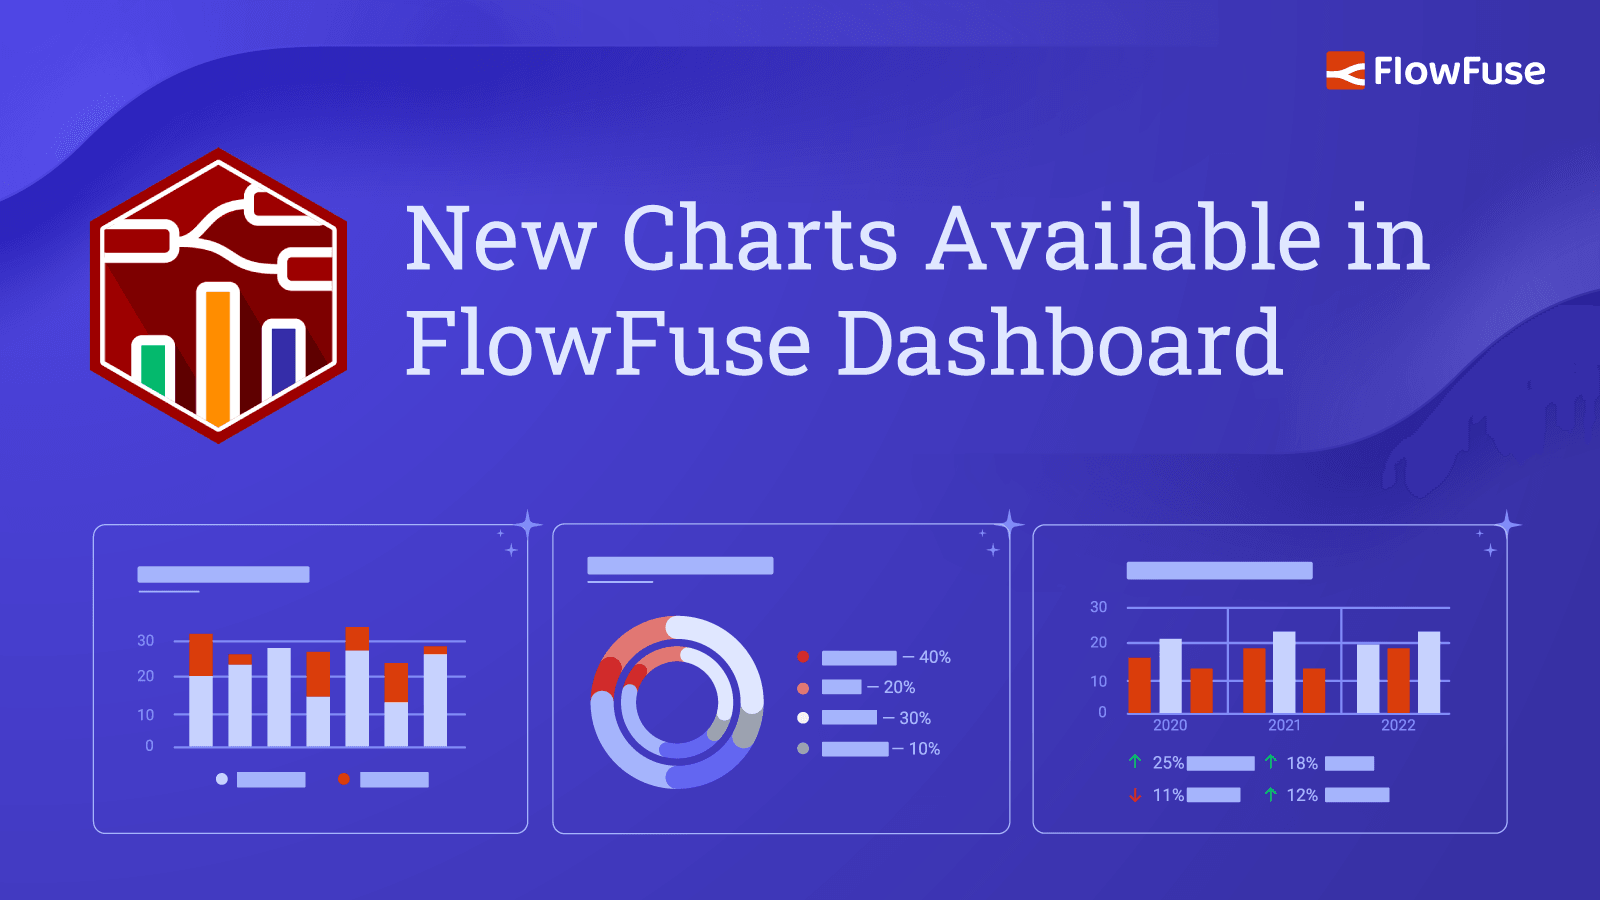
New Charts Available in FlowFuse Dashboard
It's been a while coming, but we've finally introduced a new set of chart types to FlowFuse Dashboard. We've added... -
Node-RED Dashboard Formally Deprecated
Dave Conway-Jones, the lead maintainer of Node-RED Dashboard, has just announced that Node-RED Dashboard has been formally deprecated, meaning there... -
Multi-Tenancy available for everyone with FlowFuse's Dashboard 2.0
FlowFuse Dashboard has featured multi-tenancy features through the FlowFuse User Addon. This made user based applications available only to specific... -
Exploring Node-RED Dashboard 2.0 Widgets
This guide delves into Node-RED Dashboard 2.0 widgets. It is a guide on how to build a Dashboard application, and... -
Mapping location data within Node-RED Dashboard 2.0. (2026)
Fleet management in IoT uses sensors and software to collect real-time data on vehicles, such as location, fuel consumption, and... -
Comprehensive guide: Node-RED Dashboard 2.0 layout, sidebar, and styling
In this comprehensive guide, we will explore different layouts and sidebar styles in Dashboard 2.0. Additionally, we will cover how... -
Dashboard 2.0: Milestones, PWA and New Components
With a new release of Node-RED Dashboard 2.0 we have plenty of new fixes and improvements being added to the... -

How to Build An Application With Node-RED Dashboard 2.0 (2026)
In this guide, we'll build a Todo application to guide you through the features and explain how you can build... -
Getting Started with Node-RED Dashboard 2.0
With our latest release of Node-RED Dashboard 2.0, we've made some big improvements to the onboarding experience. We're seeing over 2,000... -
Speech-Driven Chatbot System with Node-RED
Have you ever wanted to integrate speech recognition and synthesis into your Node-RED project and thought it was too complex?... -
Personalised Multi-user Dashboards with Node-RED Dashboard 2.0!
This week has seen the release of the first major version of Node-RED Dashboard 2.0, with it, we've made available... -
Node-RED Dashboard 2.0 is Generally Available!
Back in June 2023 we announced that FlowFuse would be investing into building out the next generation of Node-RED Dashboard,... -
Sentiment Analysis with Node-RED
Have you ever built a sentiment analysis system to extract insights from text content? If yes then I don’t think...