How to Build an OPC UA Client Dashboard in Node-RED - Part 3
Interactive OPC UA Client dashboard that communicates with a 3rd party OPC UA Server

This article is the third and final part of our OPC UA content series. In the first article, we cover some OPC UA fundamentals and walk through an example OPC UA Server flow. In the second article, we built a SSL-secured OPC UA server using data from an Allen Bradley PLC as a source. In this article, we show how to build an OPC Client in Node-RED that communicates with a 3rd party OPC UA Server and utilizes an interactive dashboard.
This article will requires the Prosys OPC UA Simulation Server, an application designed for testing OPC UA client applications and learning the technology. It’s a free cross-platform application that supports Windows, Linux, and MacOS. This article will use the Windows version.
Note: full source code for the OPC Client Dashboard is included at the end of the article.
Custom Nodes Used & Assumptions
Several custom nodes are required in order to properly deploy this flow. For more detailed information on how to install a custom node, follow the instructions from an earlier article where the process on installing custom nodes is explained in detail.
As this is not a production application, no security will be utilized, and it is assumed that the OPC UA Server is running on the same network as the Node-RED OPC Client.
Is it also assumed that the end user of this article has familiarization with dashboards. There are many dashboard basic guides available on our FlowFuse website, For more infomation go to Node-RED Dashboard 2.0 guides.
Install and Deploy the Prosys OPC UA Simulation Server
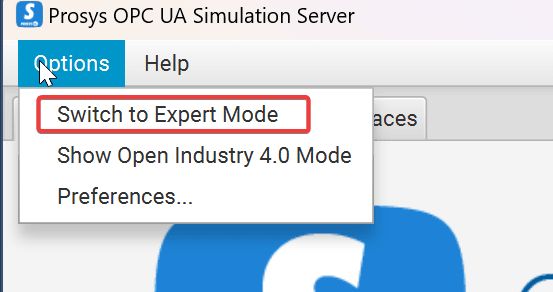
The Prosys OPC UA Simulation Server is free to download, but requires a sign-up process. Download and install the server, then run the application. Once the application is started, the first thing you should do is go to options -> switch to expert mode.
This will give us access to the address space tab, which we will need to develop our client application in Node-RED.
When the application is run, an endpoint url will be displayed on the status tab, along with an indication that the server is currently running.
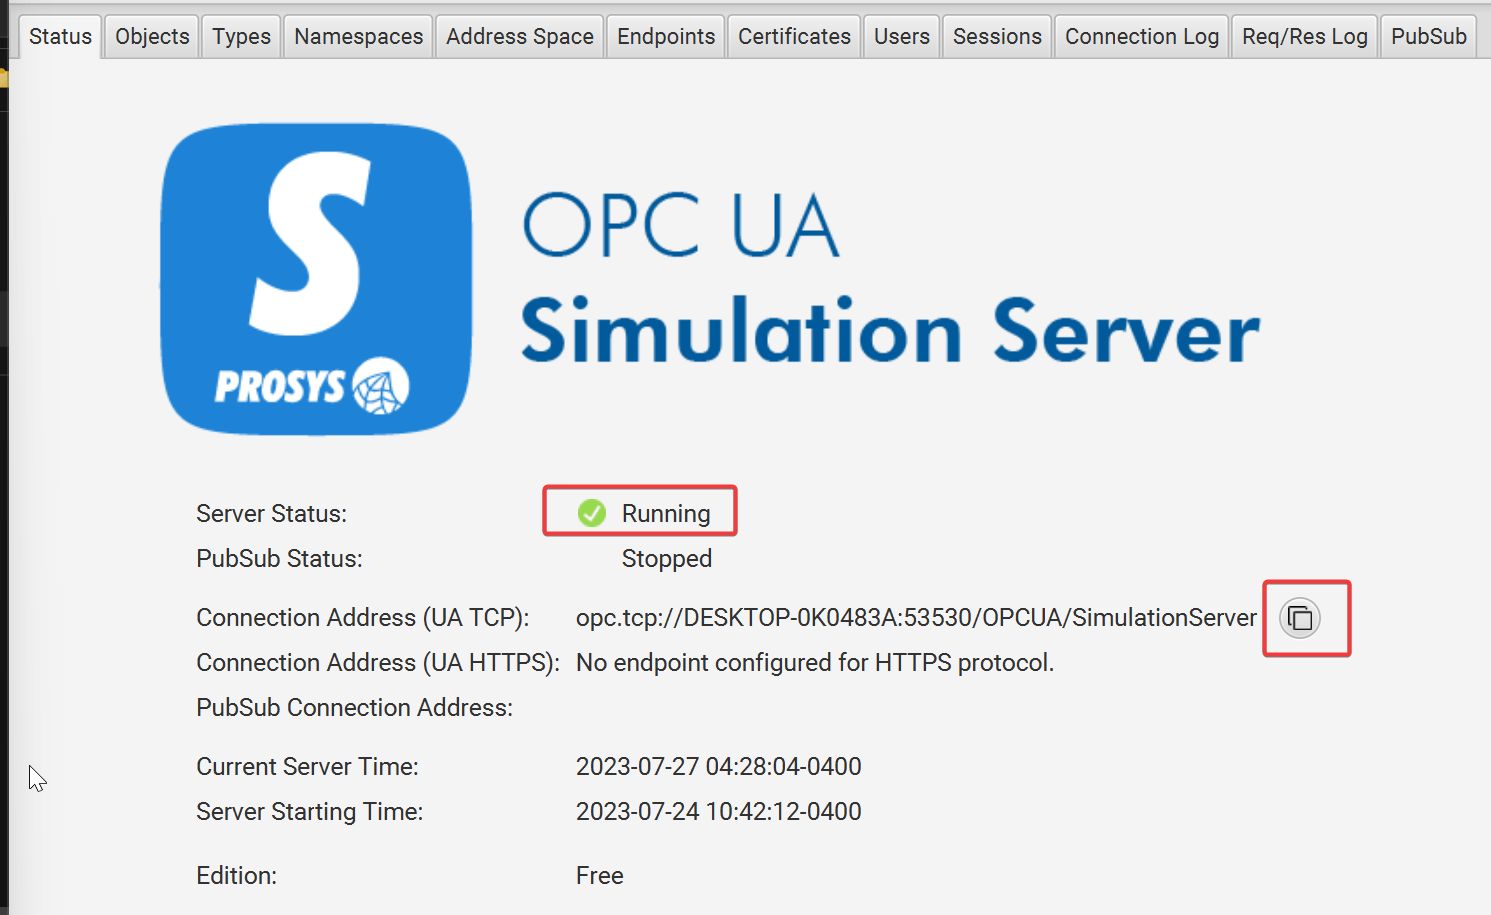
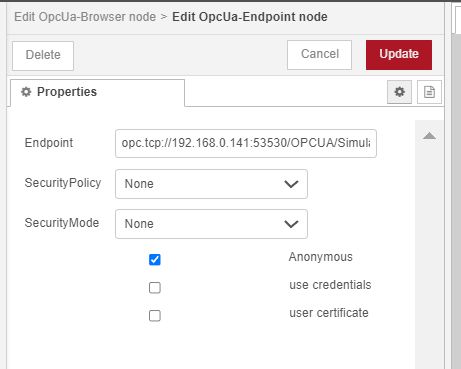
DESKTOP-0K0483A, with the actual IP address of the machine running the server. The IP address of the machine on my local network is 192.168.0.141, which changes my UA TCP endpoint address to opc.tcp://192.168.0.141:53530/OPCUA/SimulationServer.
Now the simulation server is set up and we are ready to start developing the OPC Client application.
Objectives of the Node-RED OPC Client Dashboard Application
The goal is not to develop a production-level application, rather, it’s to show a variety of features that one can utilize to demonstrate common OPC UA Client application capabilities in Node-RED, while also demonstrating a variety of methods to visualize the results in a dashboard. There are 4 main objectives of the Node-RED OPC Client Dashboard application. They are:
- Browse hierarchical server address space structure & display on a dashboard
- Read OPC UA values from various namespaces, showing a variety of datatypes and different ways they can be visualized
- Write OPC UA values back to the OPC UA server directly from the OPC UA Client dashboard
- Read alarms & events from the OPC UA Server and display them on the dashboard
Rather than building the flow step-by-step, the flow source code will be presented for each objective, and a the flow will be explained so that it is understood what is happening in each section of code.
Browse Hierarchical Server Address Space Structure With OPC UA Browser Node
The first flow will browse the hierarchical OPC UA Server address space structure and display it on the dashboard.
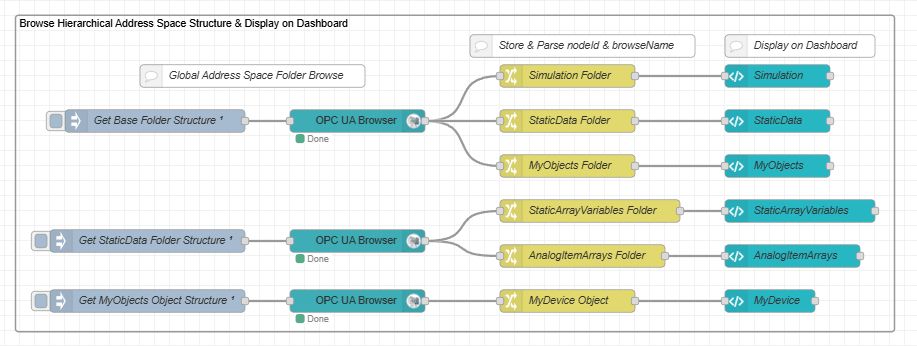
You can import this flow into Node-RED using the code below:
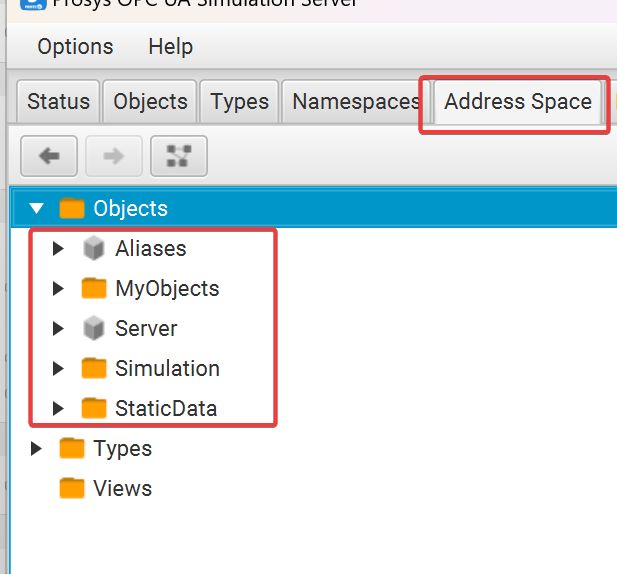
To understand what is going on in this flow, we must refer back to the OPC UA Simulation Server Address Space tab.
When we browse the OPC Server base folder structure in Node-RED, we will be browsing everything included under the Objects tree.
Topic blank. By doing this, we will browse the entire folder structure by default.

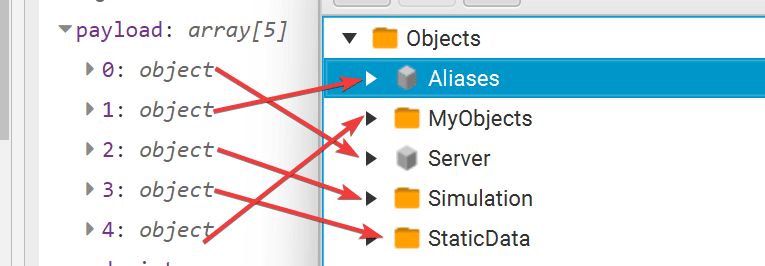
Using the output of a debug node, we get from the OPC UA Browser yield a payload with an array of 5 objects.

Each object returned represents the 5 objects that are in our OPC UA Server Objects tree.
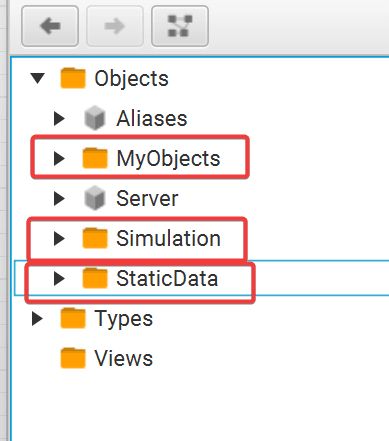
However, of those 5 objects, only 3 of them are folders that contain actual OPC values. MyObjects, Simulation, and StaticData. We can ignore Aliases and Server.
So looking deeper into the payload of our global browse from the OPC UA Browser node, we can drill down into the details and see how they correlate with the folders in the server.
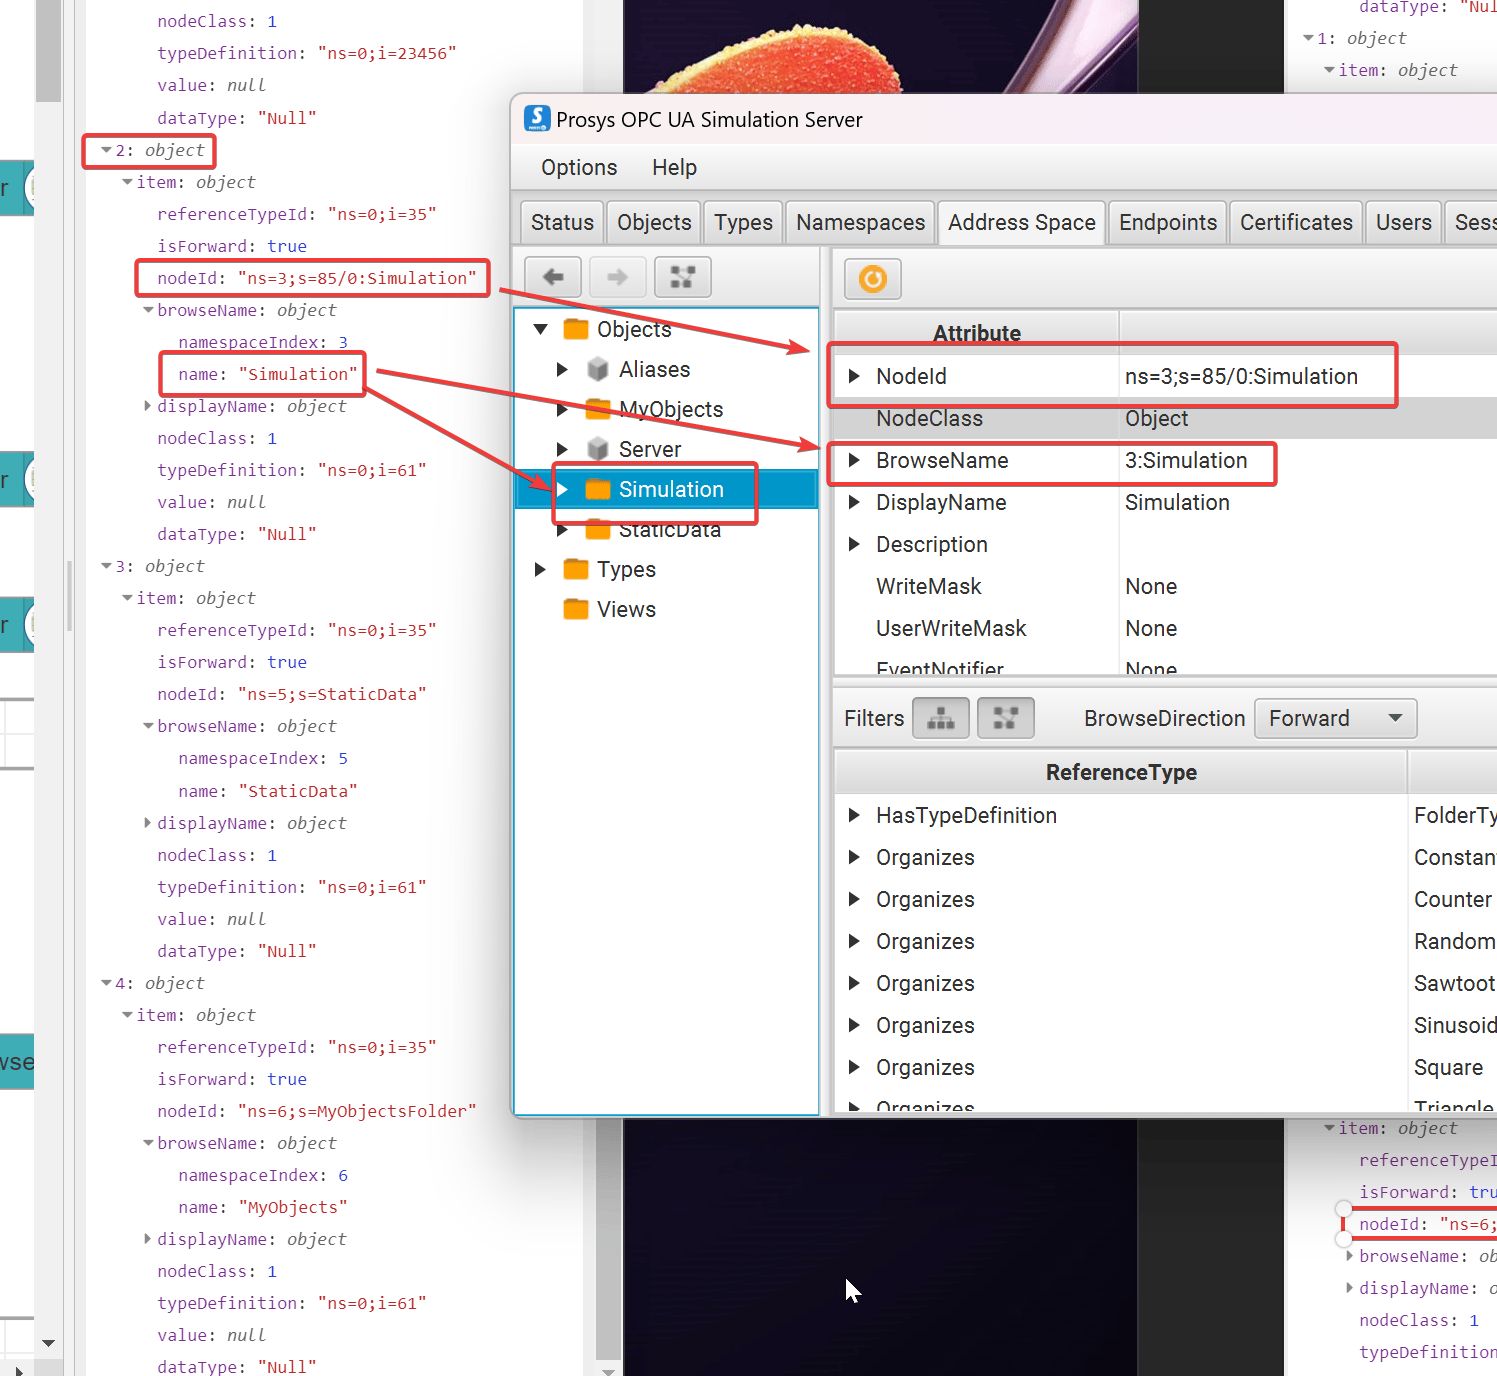
As shown above, element 2 in the array returned from the global browse corresponds to the Simulation folder. And we are interested in two important values in this data-structure - the NodeId, which is topic an OPC Client uses to point specific OPC values, and the browseName, which is the name we see visually when we try to identify an OPC topic. We can now use this logic to parse out this useful information using a change node.
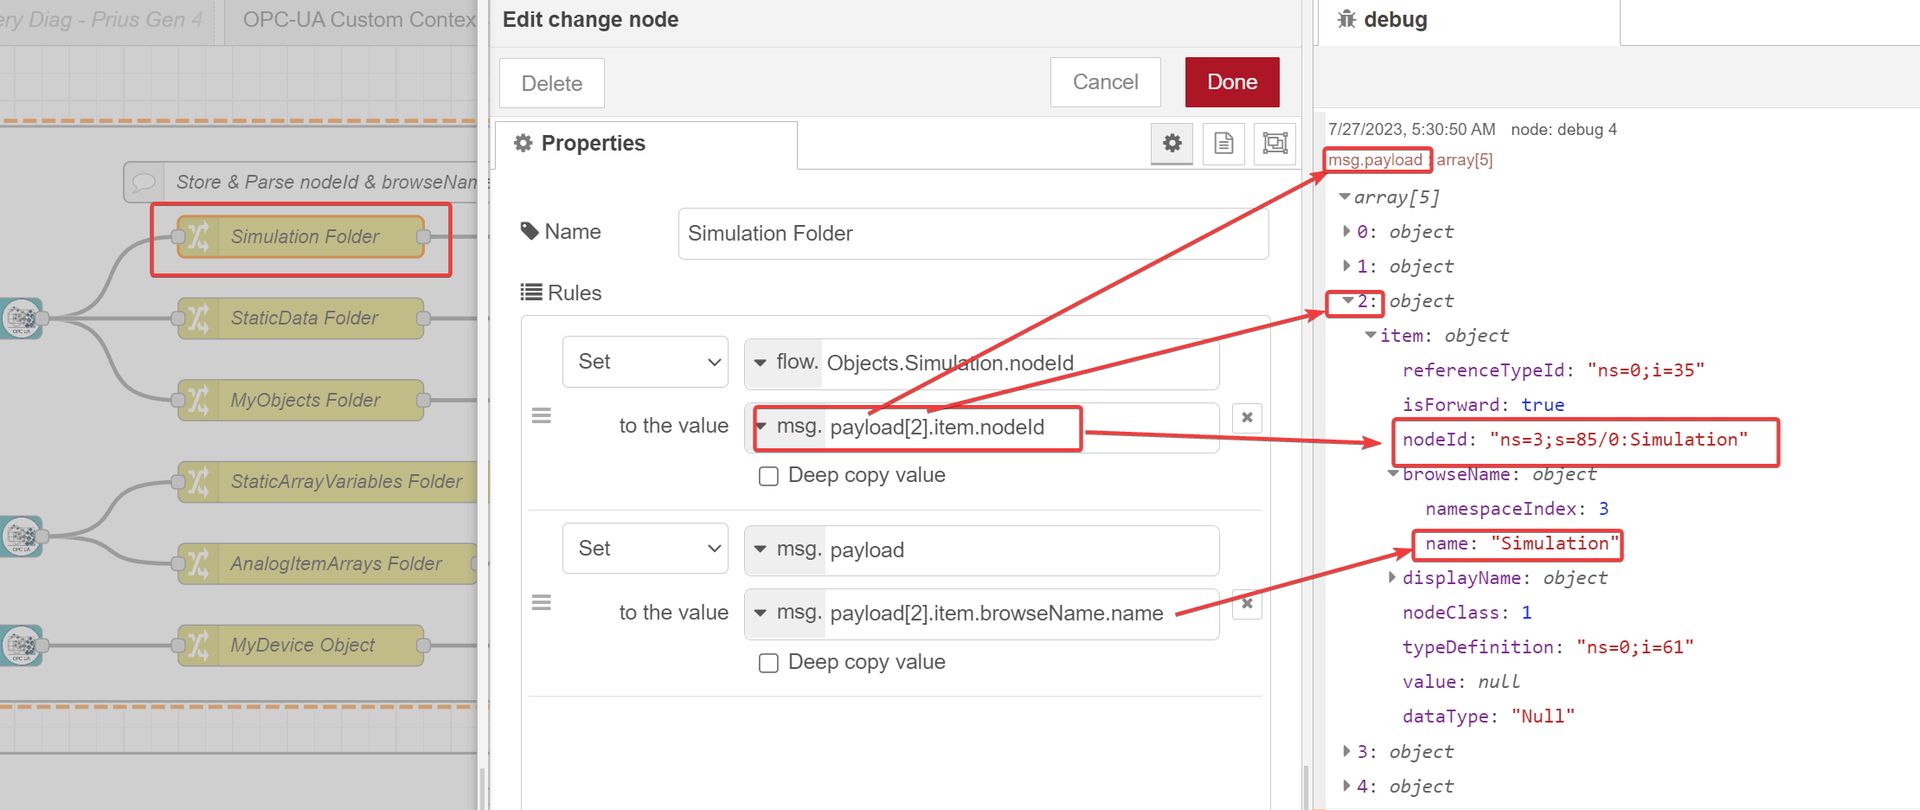
nodeId and browseName . The nodeId is stored in a context variable for later use, while the browseName is used as the payload to be displayed on our dashboard.
The rest of the flow follows this same pattern, to end up with a folder structure that we can display on our dashboard that matches the structure on our OPC Server
- note - to make the flow more manageable, not all browsable folders were included in the dashboard, as this flow is just meant to serve as an example, rather than be a 1:1 copy of everything in the server.
If you deploy the flow and pull up the dashboard, it results in the following output -
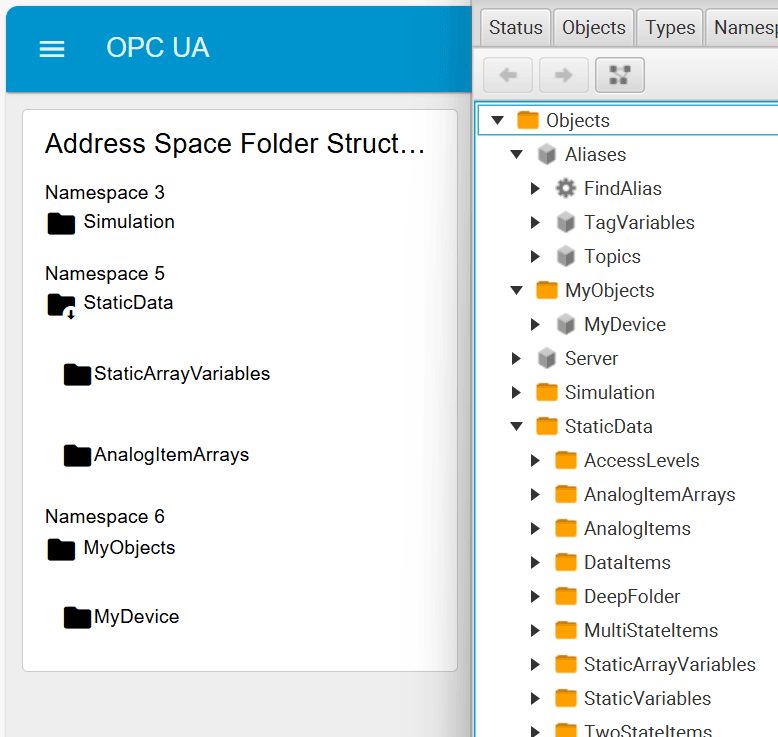
OPC UA Browser node. The browser node is best used for reading OPC UA values, which will be covered next.
Read OPC UA Values Using OPC UA Browser Node
The next set of flows read OPC UA values from the server and displays them on the dashboard.
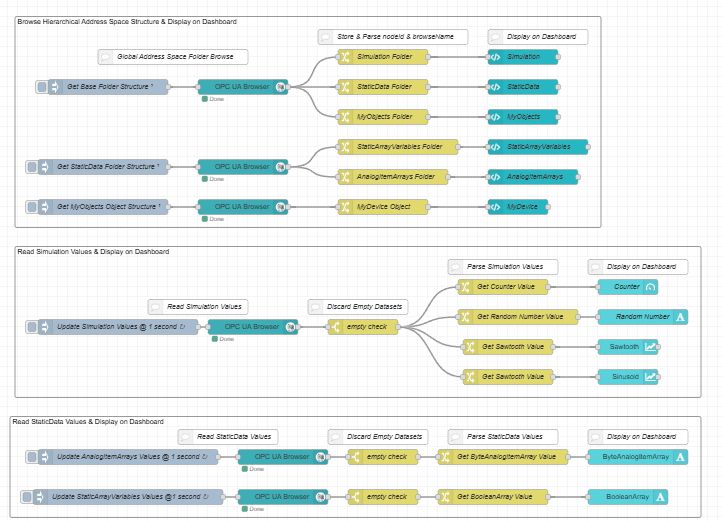
The values are derived from the nodeId values we stored in memory in our previous flow, via our change nodes in the previous flow.
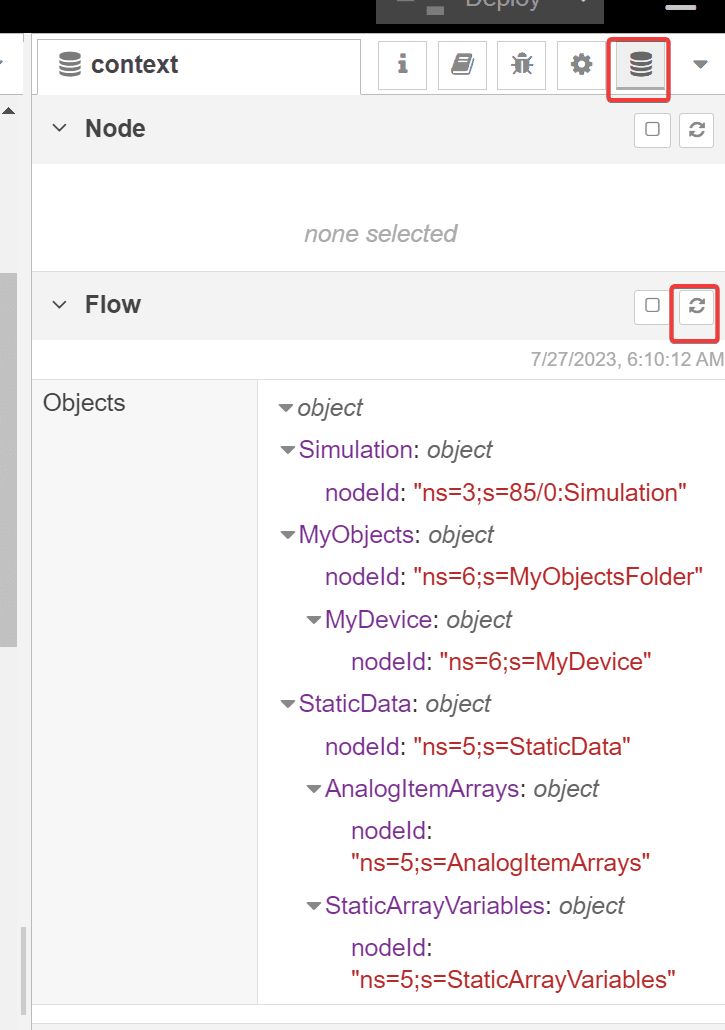
nodeId. So we will use these node IDs to read actual values from our OPC nodes.
In our first flow, we want to read the values in the Simulation folder at a 1 second interval. So we use an inject node with a msg.topic that references the nodeId corresponding to the Simulation folder.
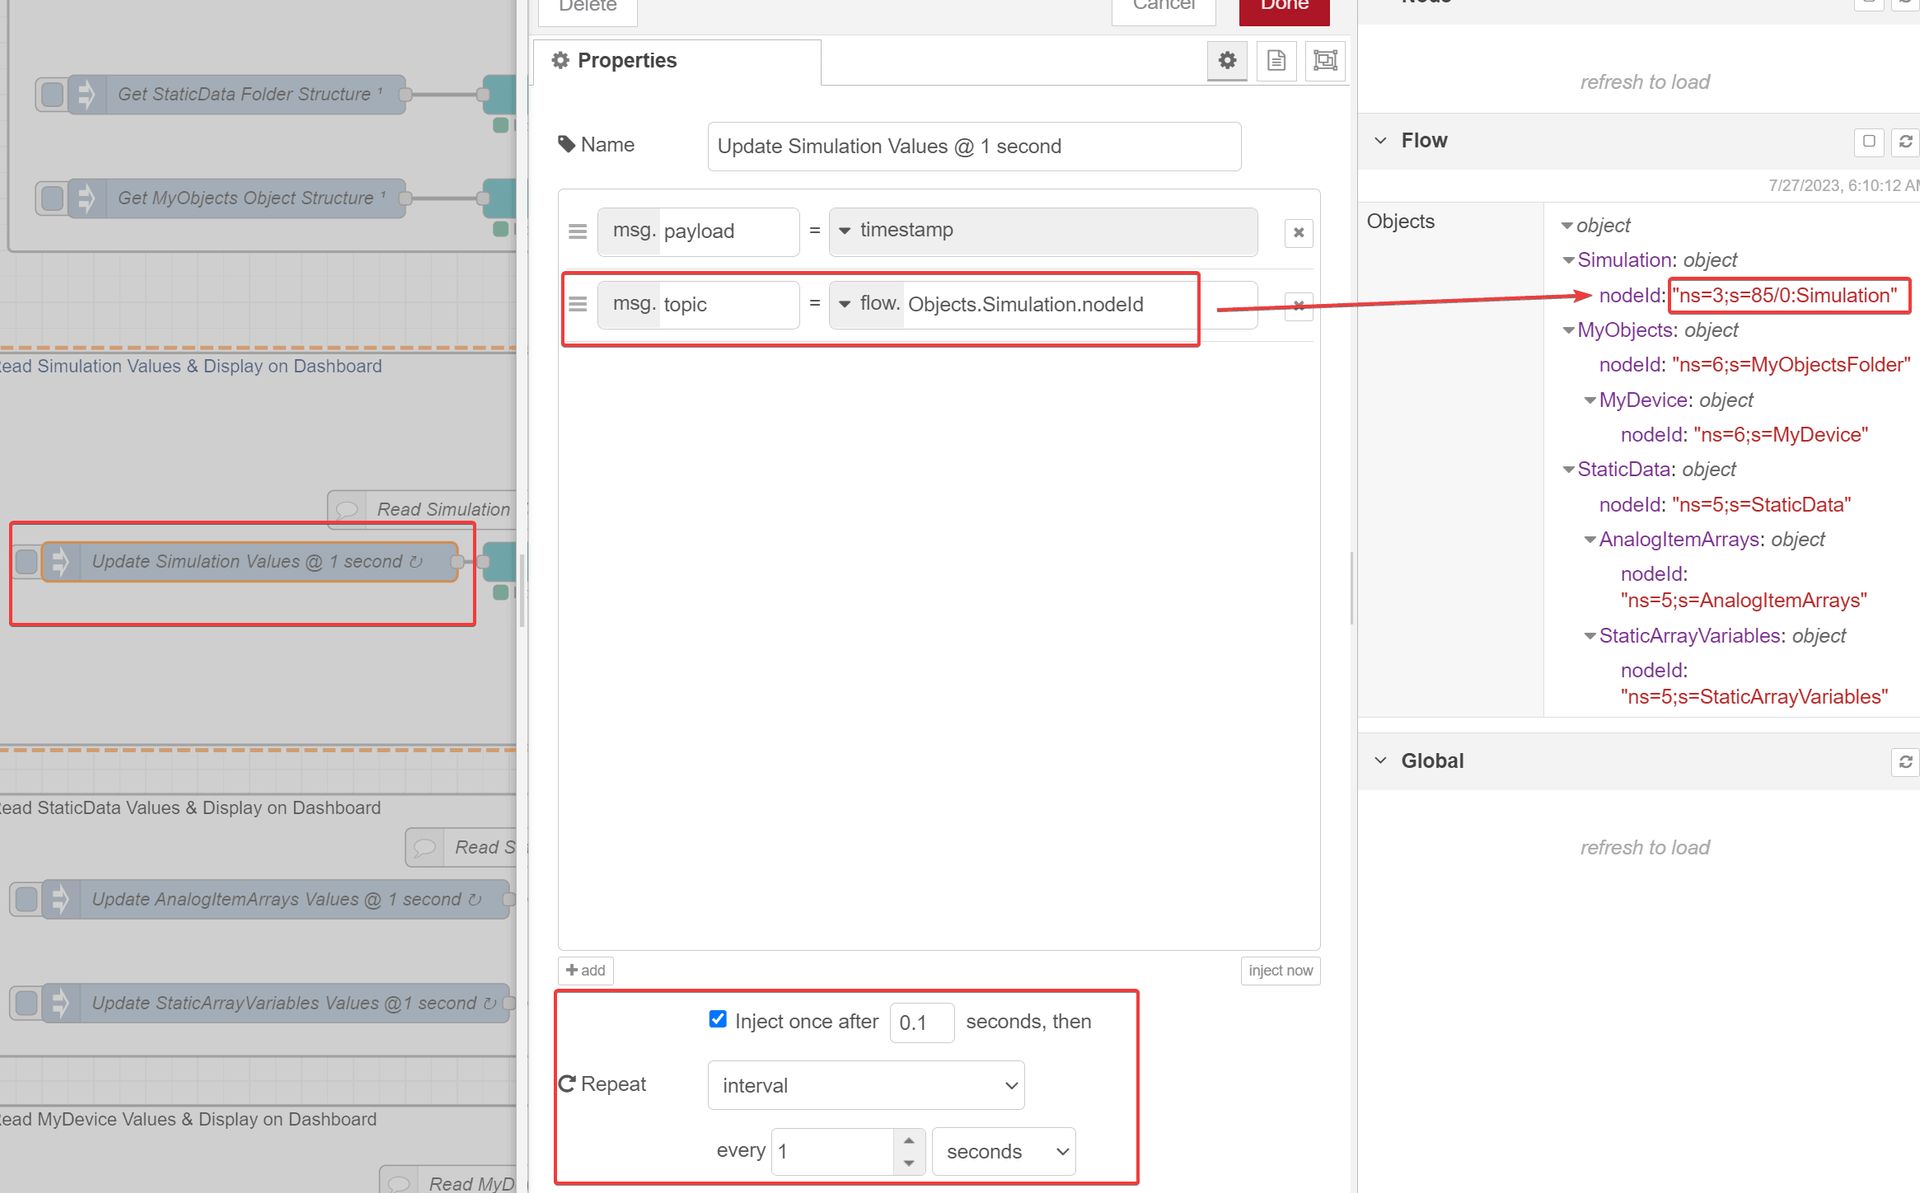
msg.topic tells the OPC UA Browser node what nodeId to browse. If we look at the debug output of the browser msg.payload, we can see that it produces an array of 7 objects, and an empty set array.

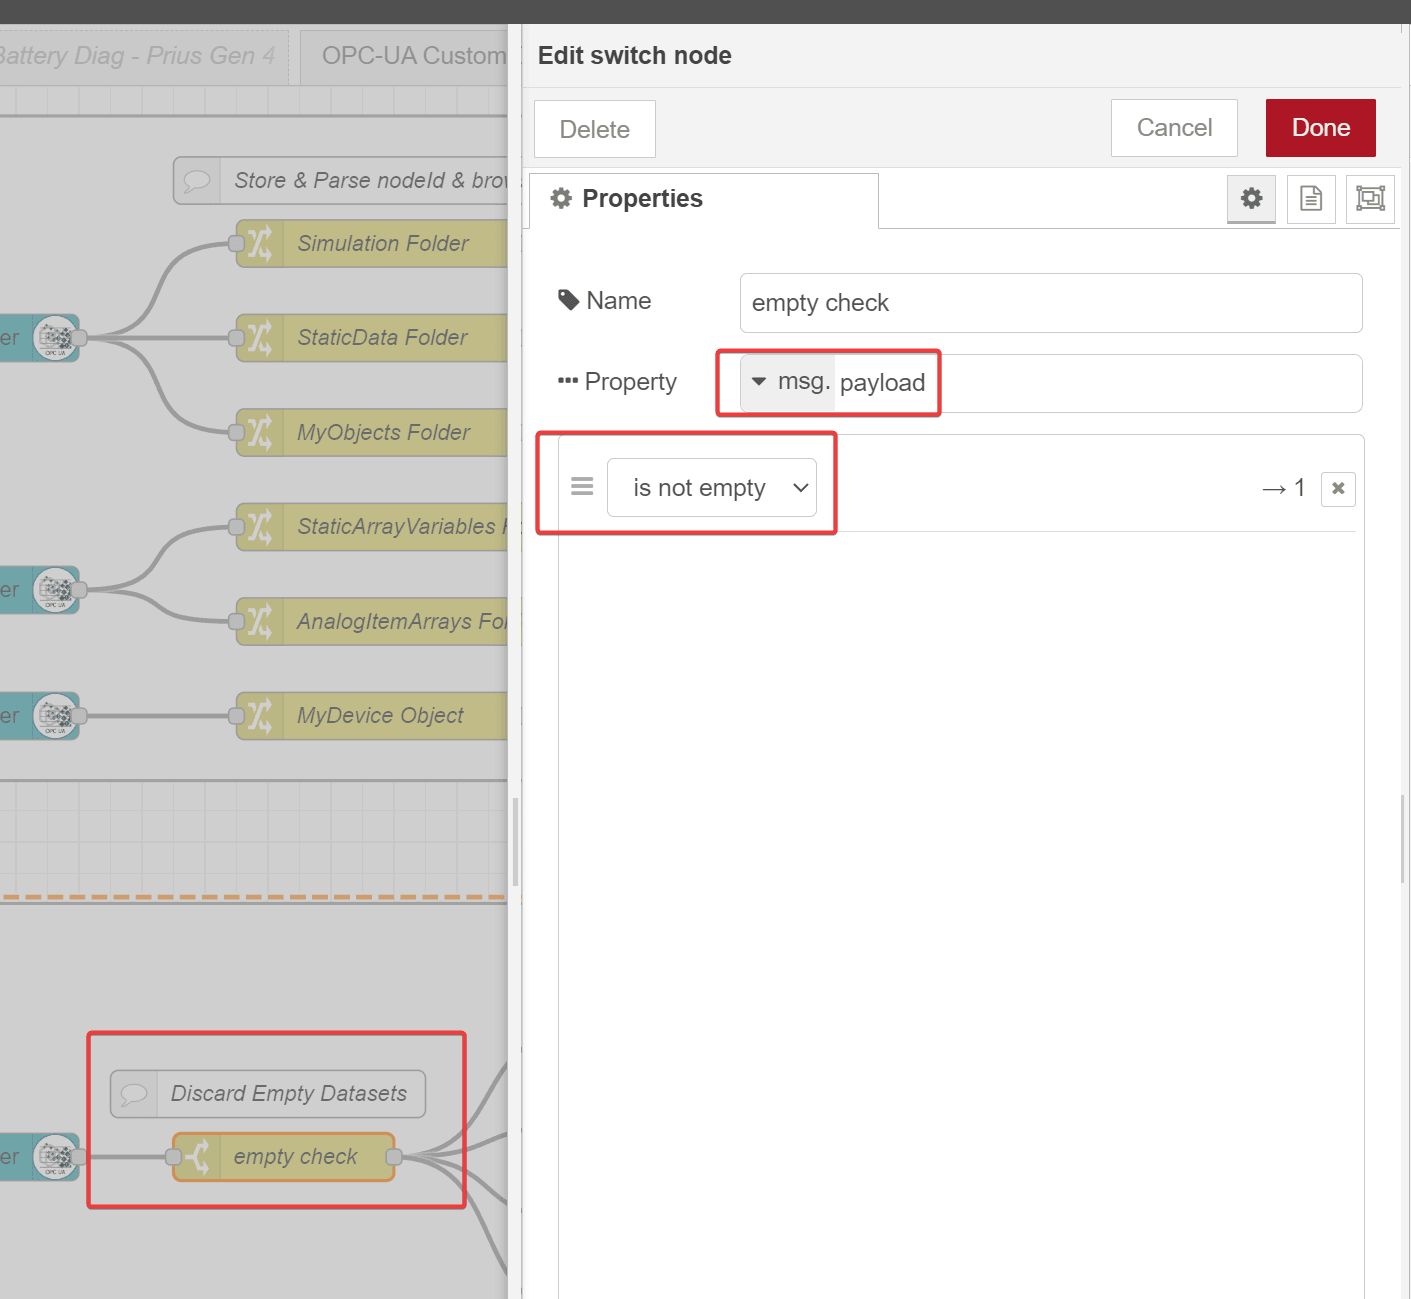
switch node to filter out the empty set.
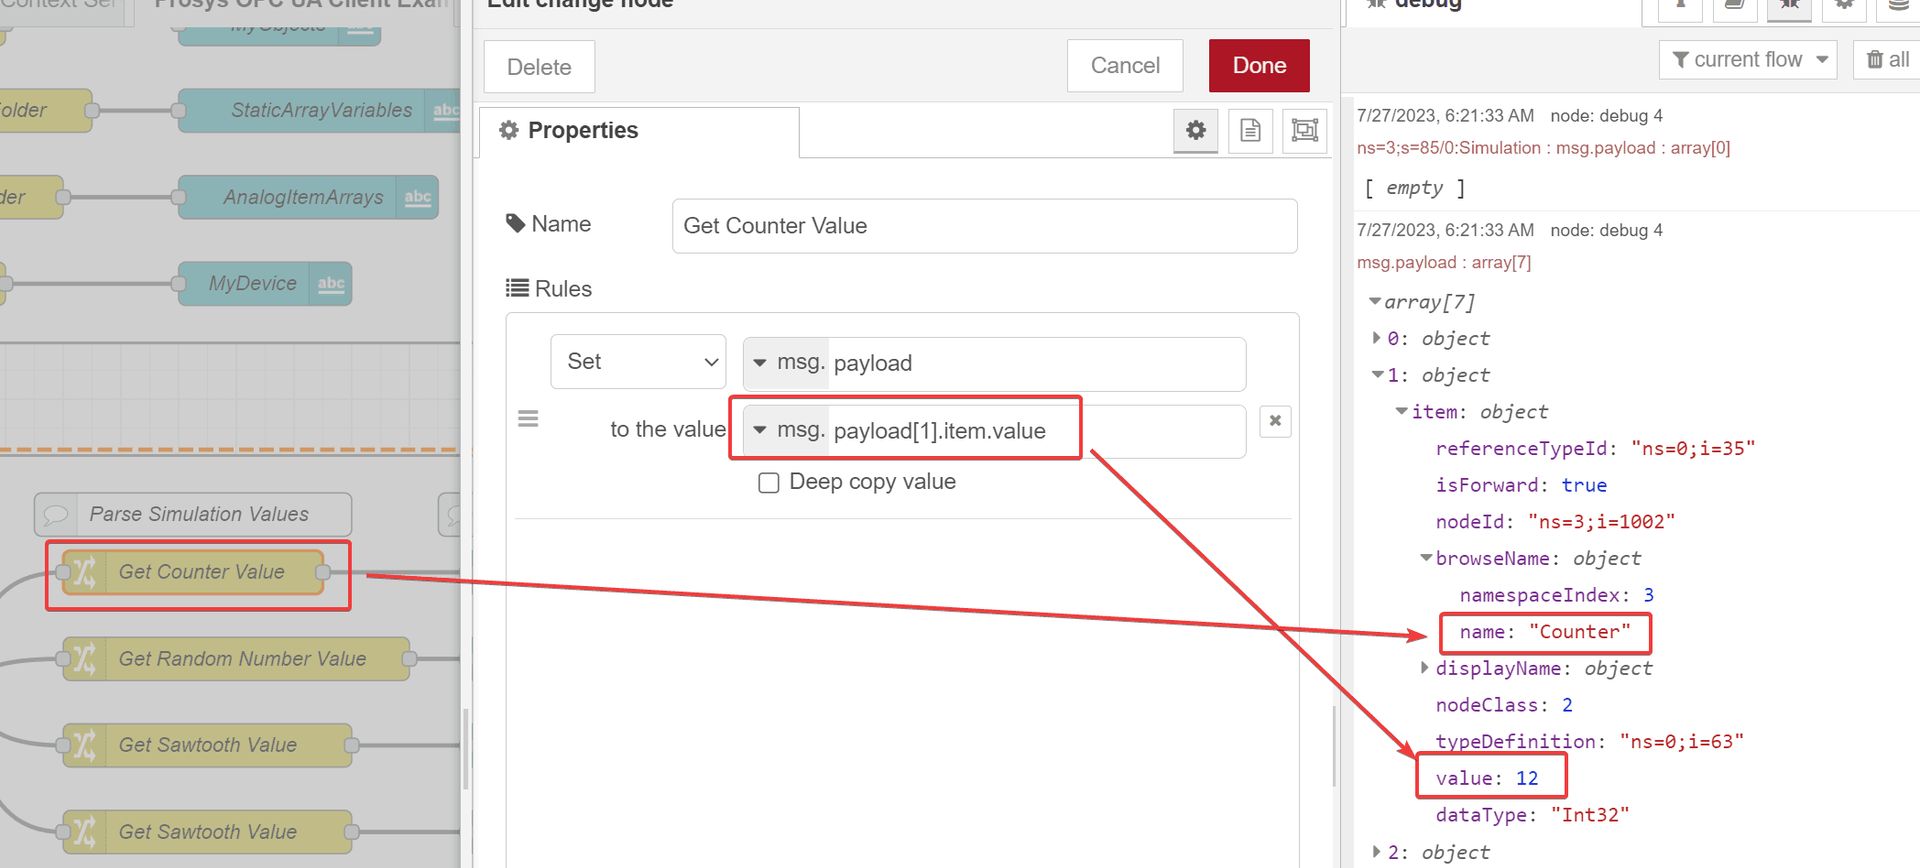
Now we can actually read the values. To do this, we use a change node again, referencing the non-empty payload and drilling down to the value that corresponds to the name of the node we want to read. In this case, we’re getting the value of the node Counter located in the Simulation folder.
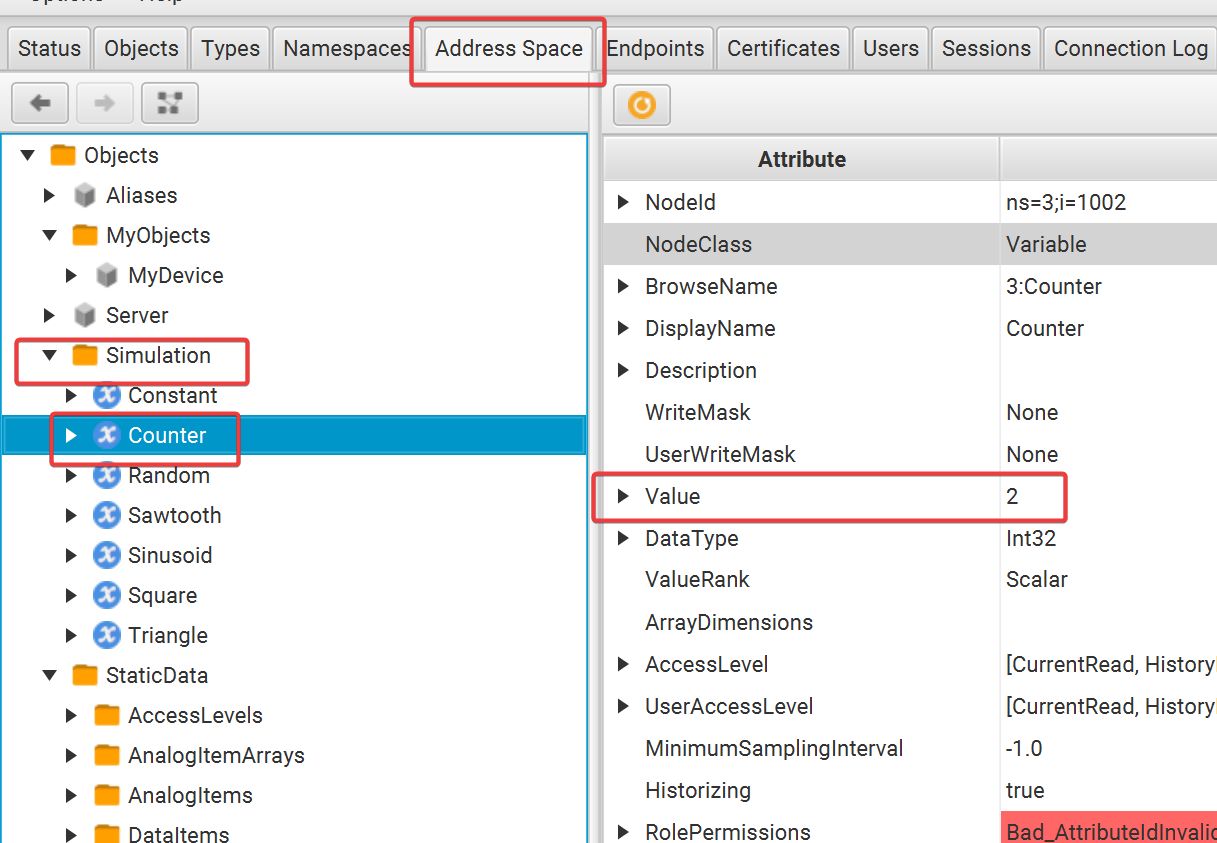
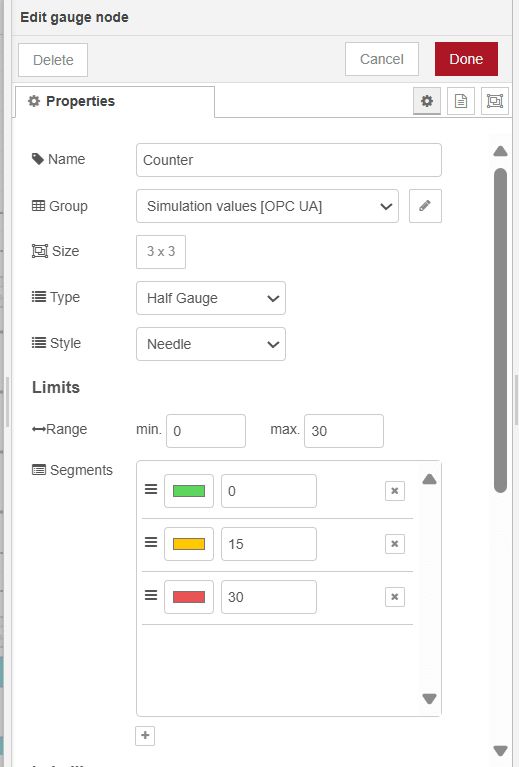
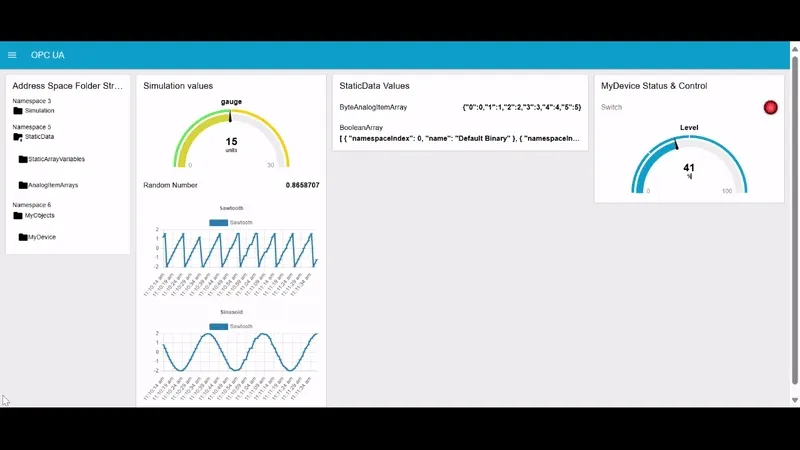
Now we add a gauge dashboard node to visualize the counter on the dashboard. In the OPC Server, it is shown that the counter increments in a range of 0-30 in 1 count increments.
The end result on the dashboard now looks like this -
Write OPC UA Values To Server Using OpcUa-Item and Opc-Ua-Client Nodes
The next flow writes OPC UA values to the server using dashboard UI elements.

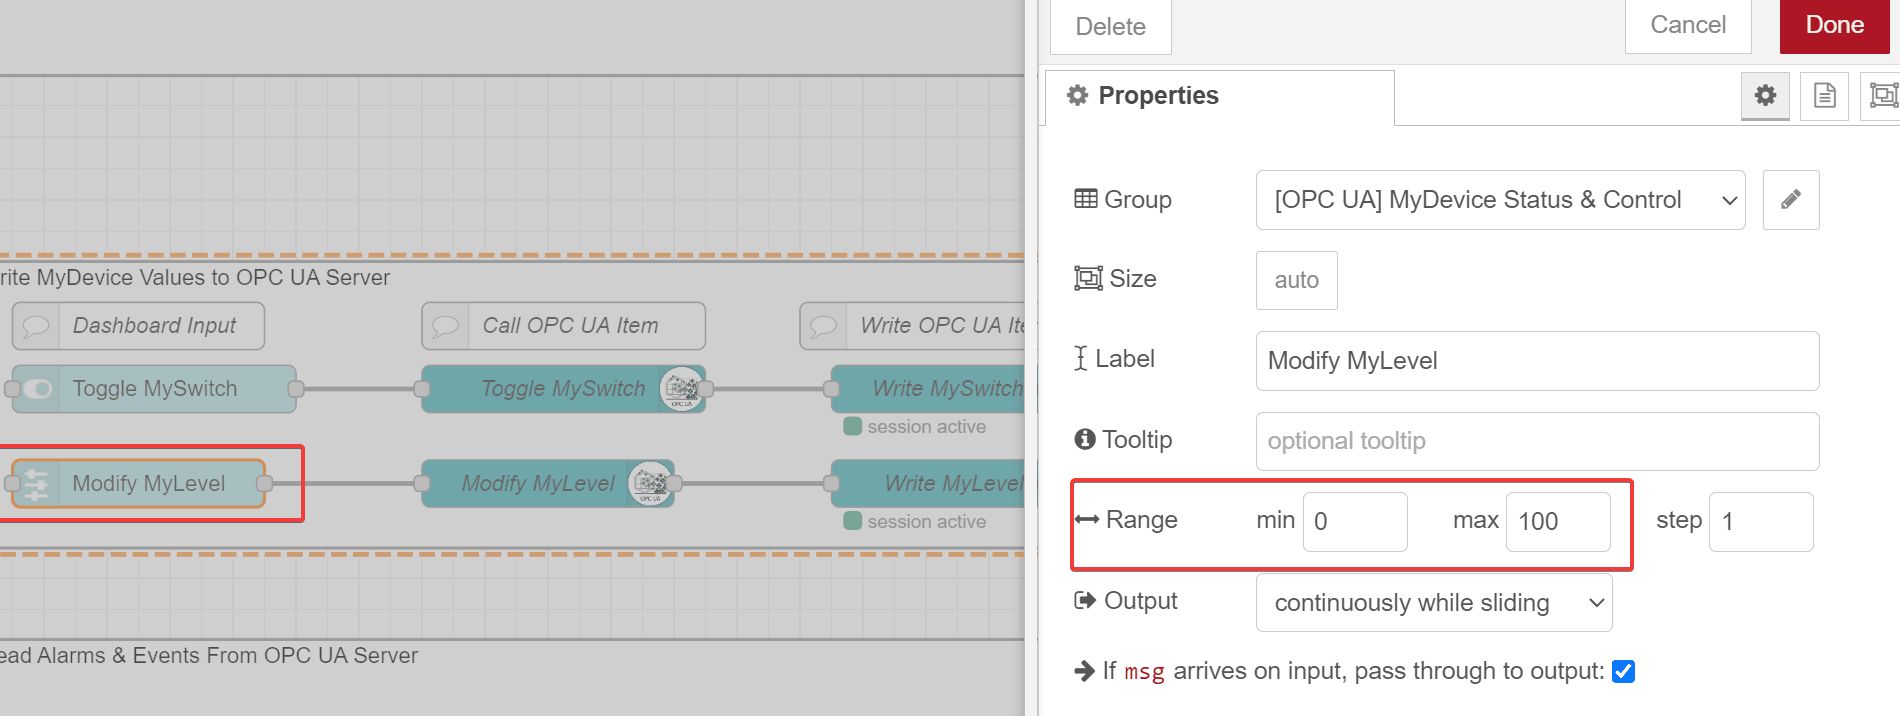
We have two values to write, a boolean value corresponding to the node object MySwitch, and an integer value corresponding to the object MyLevel. Therefore, we will use a toggle switch to toggle the MySwitch, and a slider to modify MyLevel.
There’s no need to modify the toggle switch properties, other than giving it a name. The slider needs to have the range modified to match the range of the level, which is 0-100%.
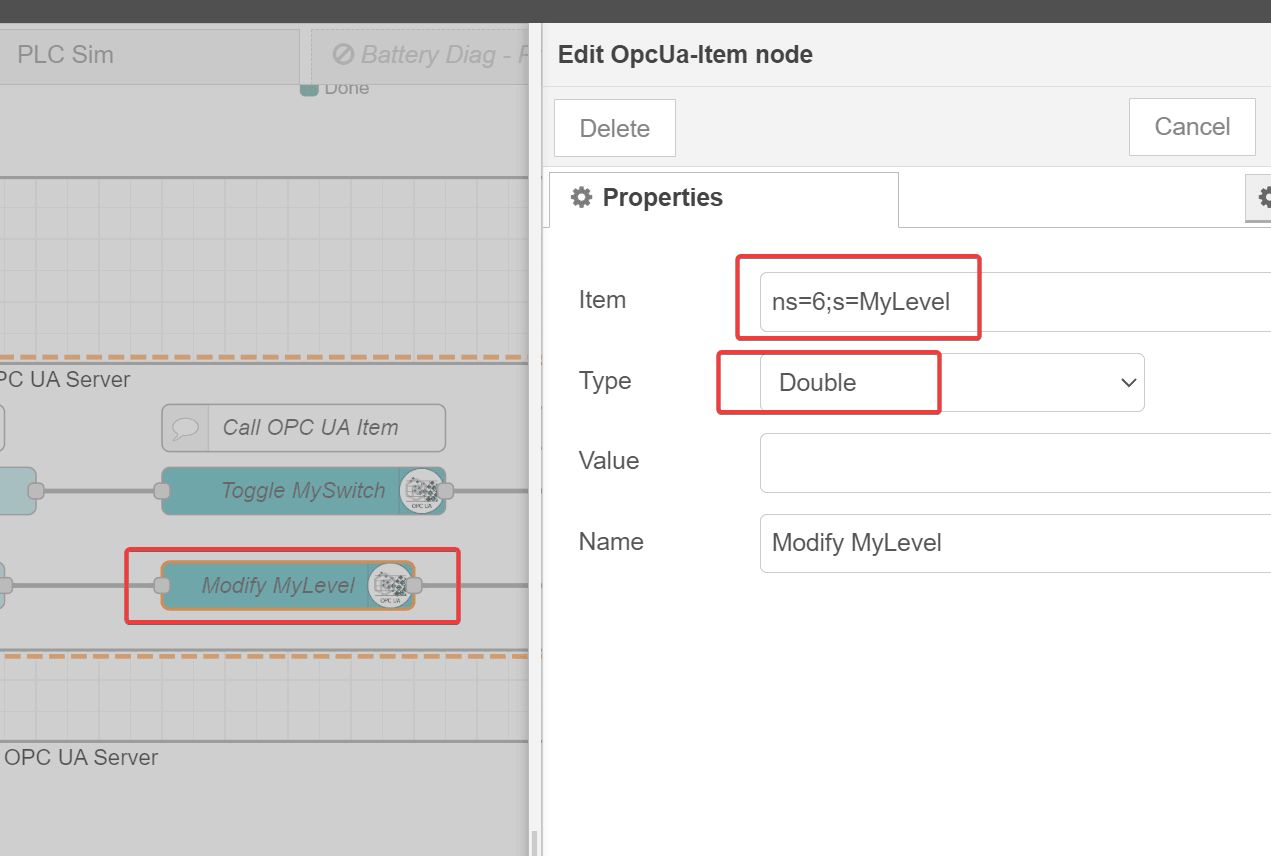
OpcUa-Item nodes, copy the NodeId corresponding to each device,

OpcUa-Item node. You must also ensure the data-type matches with the value you’re writing to.
Opc-Ua-Client needs to have an endpoint and the action changed to WRITE.
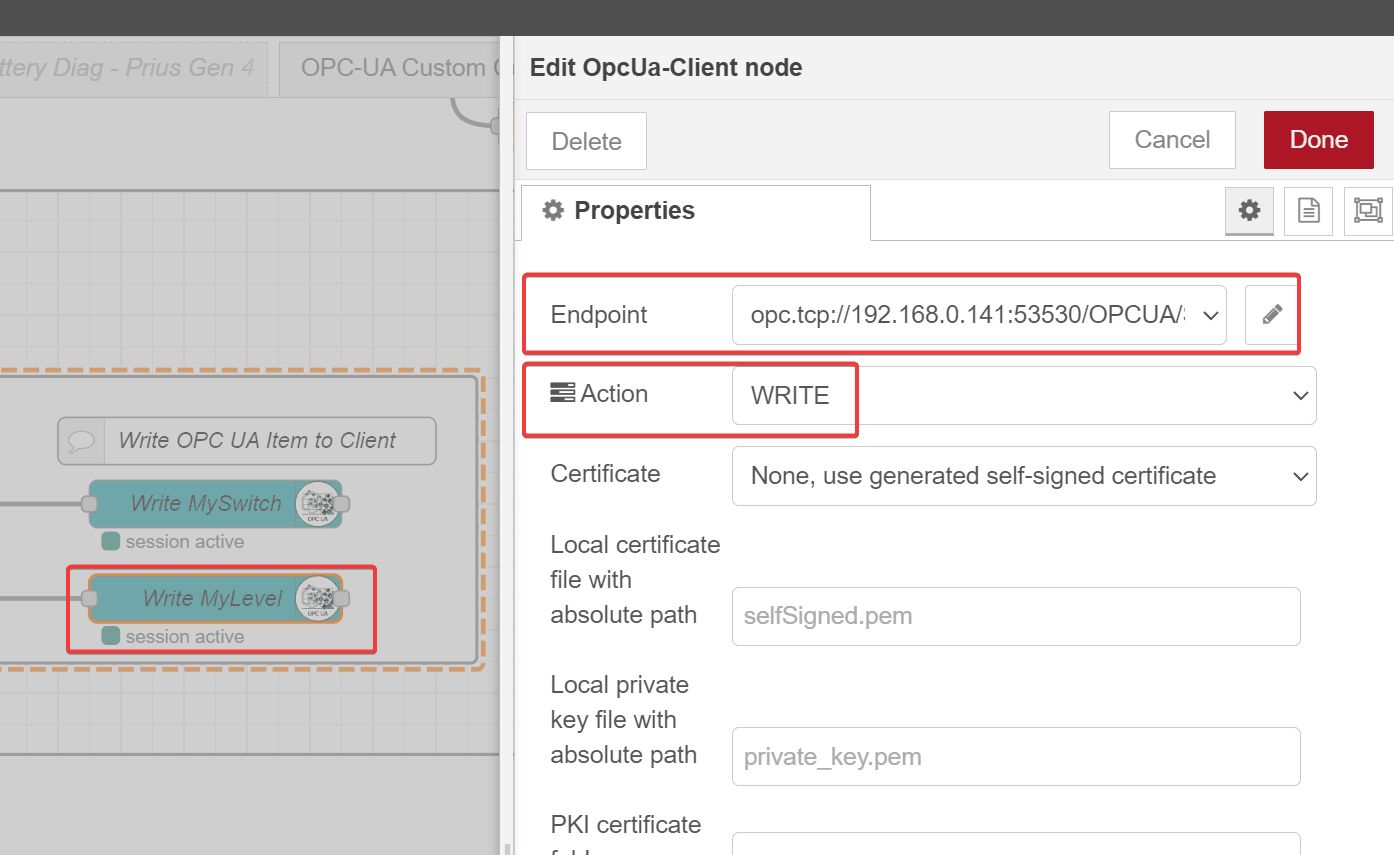
MySwitch and MyLevel, the only difference being what NodeId is referenced in the OpcUa-Item node.
When deployed, you can confirm values are being written to from the client to the server from the dashboard.
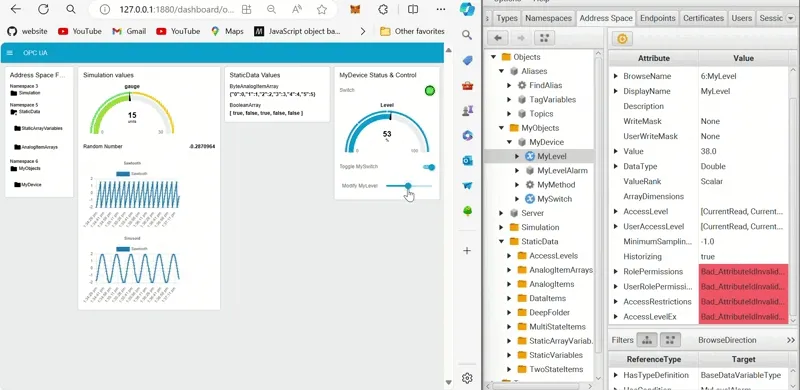
Read Alarms & Events from OPC UA Server Using OpcUa-Event and Opc-Ua-Client Nodes
Our last flow we’ll show how to read OPC UA Alarms & Events.

We use an inject node to trigger the OpcUa-Event node. In the properties of the event node, we get the NodeId from the MyLevelAlarm event from the OPC Server -
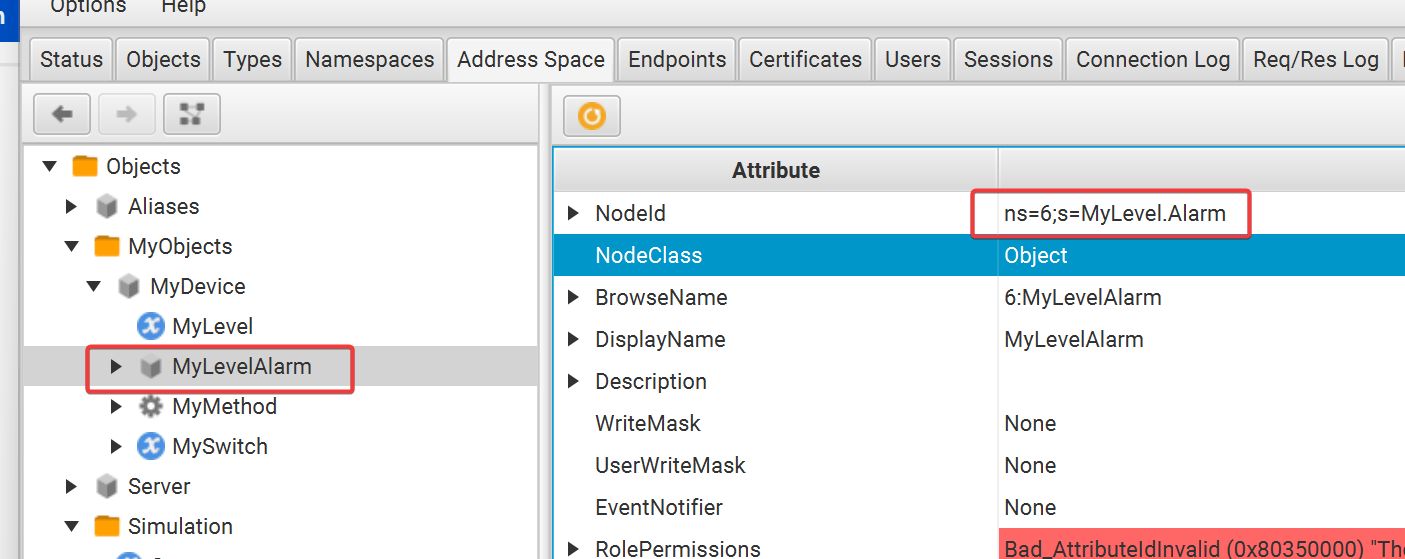
NodeId into the OpcUa-Event node. Event type will be BaseEvent (all).
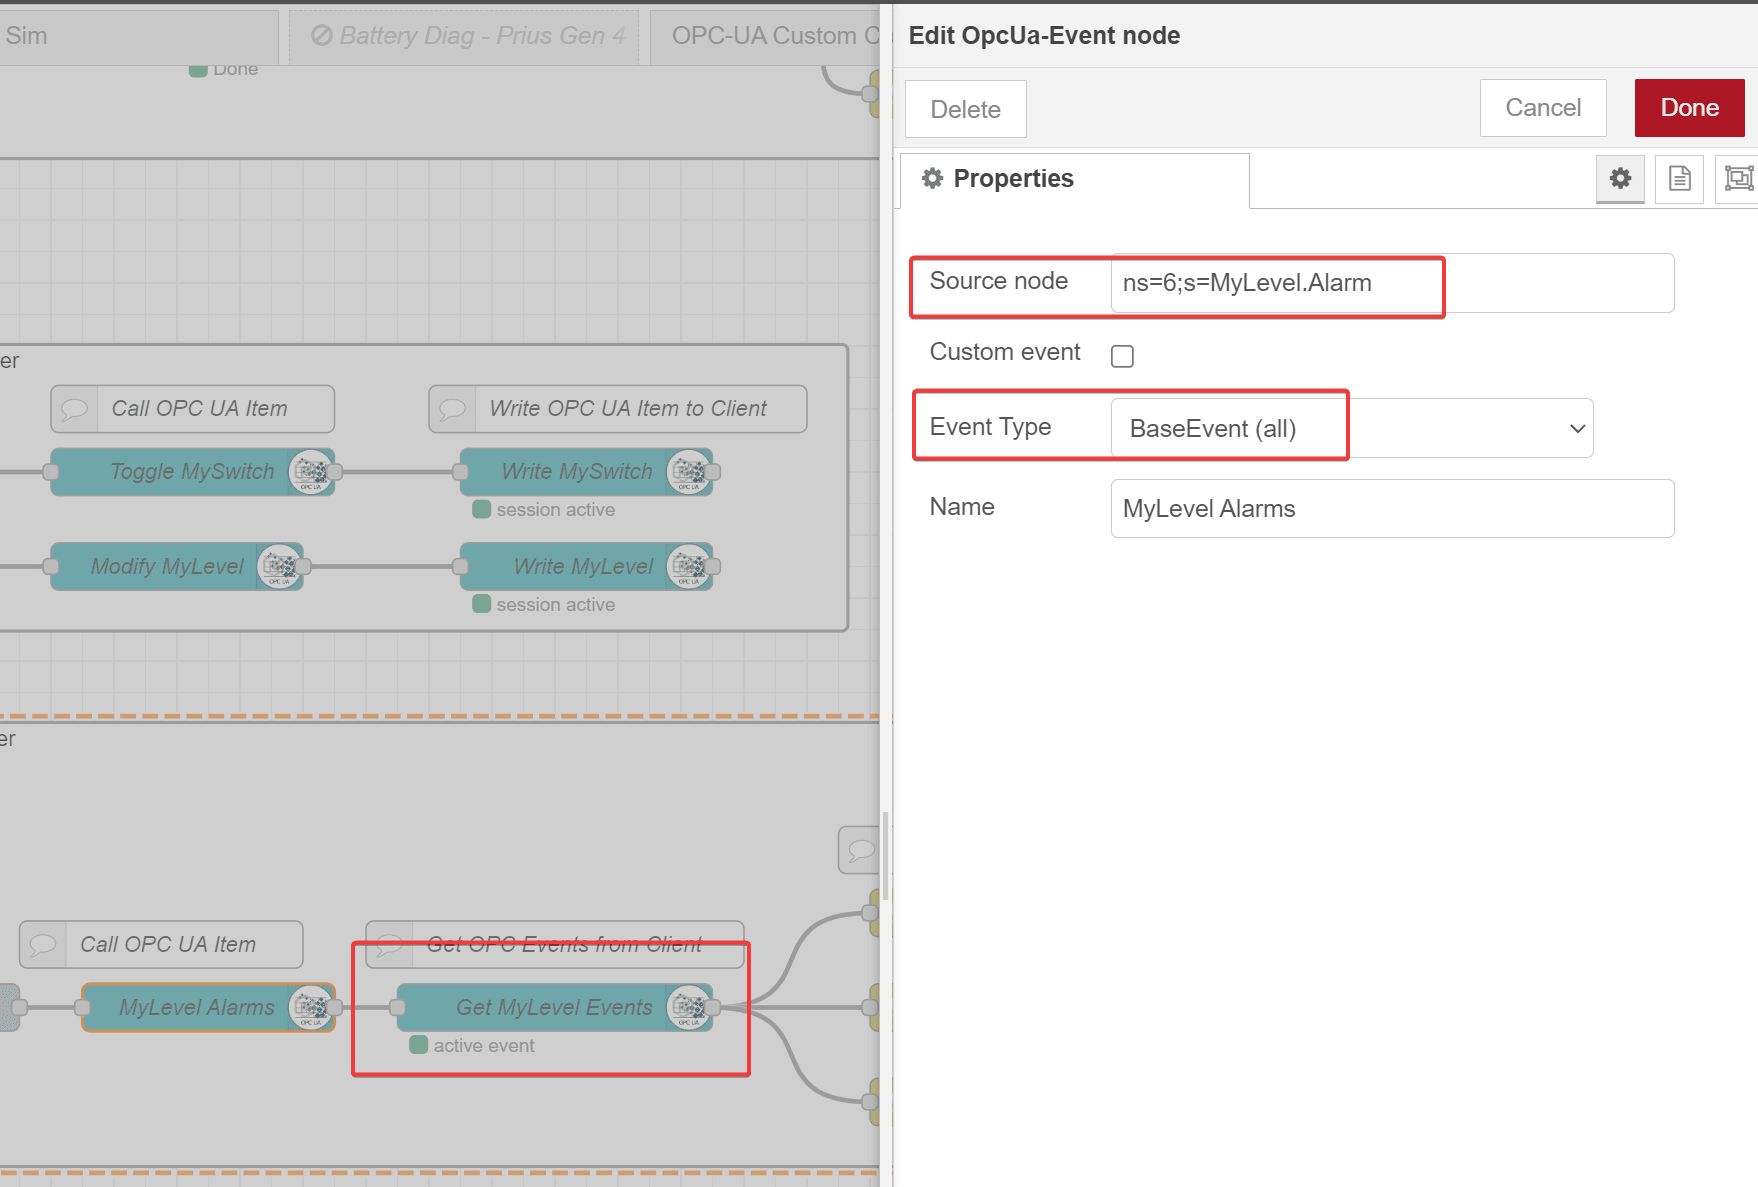
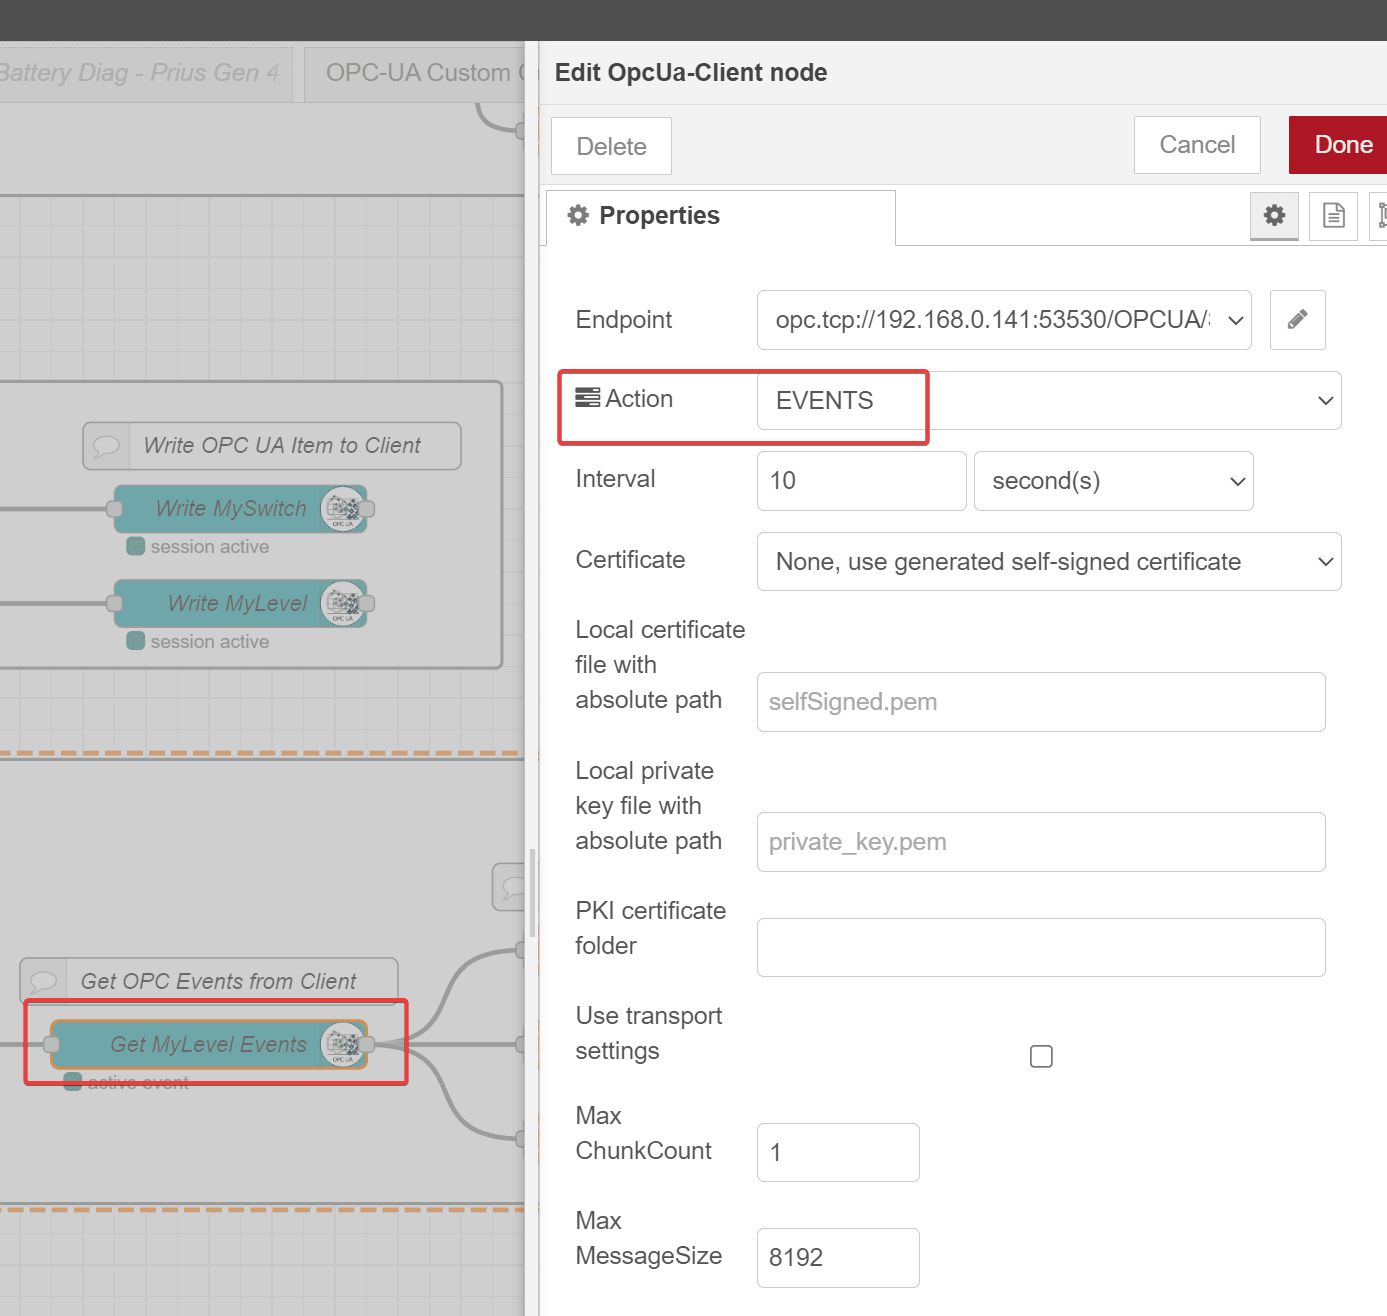
Opc-Ua-Client node, we set the Action to EVENTS.
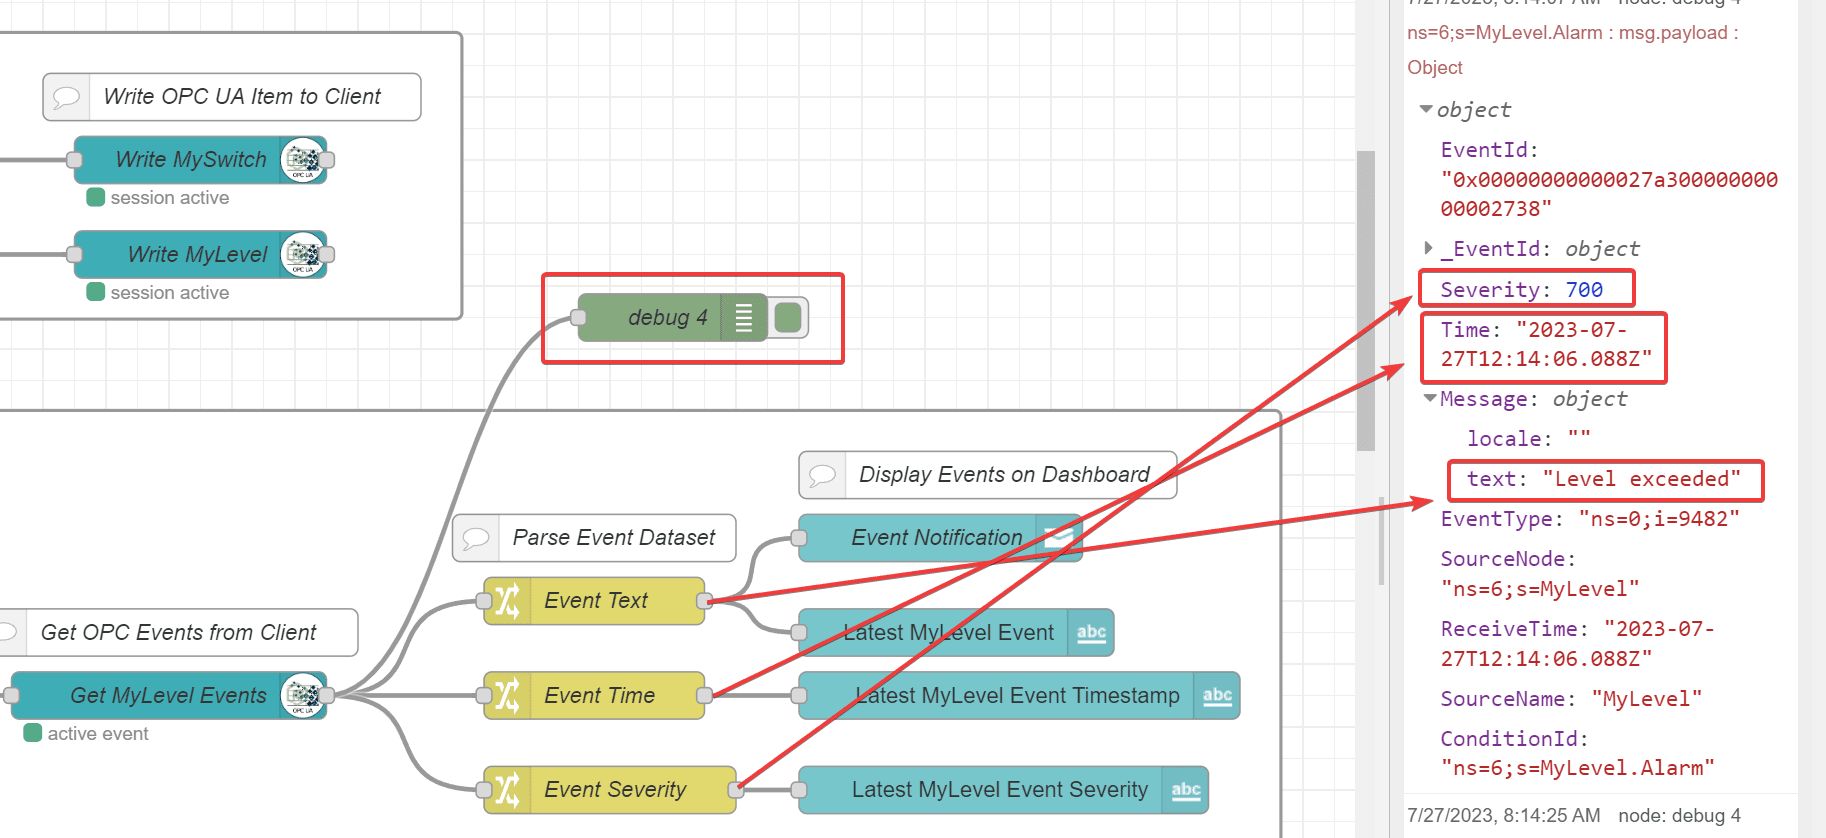
MyLevel exceeds certain thresholds (10%, 30%, 70% and 90%) it will flag a Level Exceeded alarm. The event is timestamped and assigned a severity level, which we will record and put onto the dashboard.
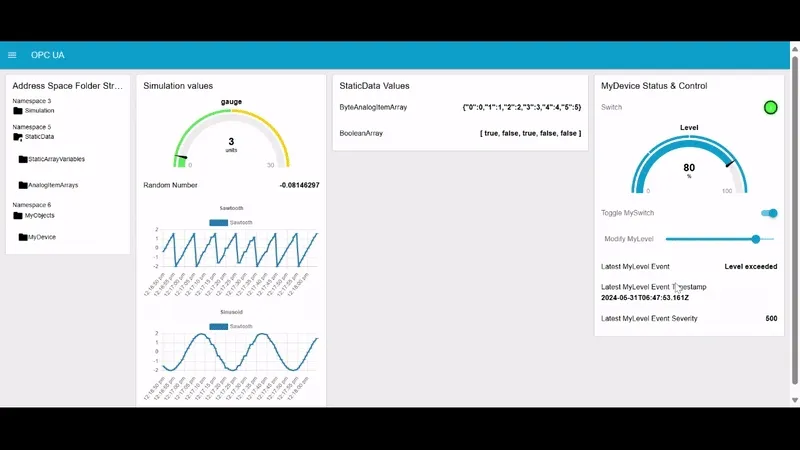
To make things simple, we’ll only track the last event. But in a production system, you’d likely want to store these events in a relational database (historian) to keep an alarm history. We’ll also include a notification pop-up when an alarm occurs to notify someone monitoring the dashboard a new alarm has occurred.
Adding alarms and events to our dashboard creates the following result -
Using FlowFuse to Enhance Your Node-RED Application: Security, Scalability, and Robustness
So, you've successfully built your Node-RED application—congratulations! But now, how do you ensure its security, scalability, and ease of collaboration? What if you want to invite your team to work on the application simultaneously or access it remotely?
Enter FlowFuse, a cloud-based platform designed to add production-grade features to your Node-RED applications. With FlowFuse, you can seamlessly integrate advanced security measures, scale your application as needed, and collaborate effortlessly with your team. It simplifies management and deployment, turning your Node-RED project into a robust, scalable solution.
If you're interested in learning how to use Node-RED for professional use cases, check out our eBook: Ultimate Beginner's Guide to Professionals. For additional resources, visit our Node-RED Learning Resources section, where you can explore integrations with different protocols, messaging services, databases, hardware, and much more.
Conclusion
In this final article, we went over building a OPC UA Client dashboard that can browse the address space, read values from an OPC Server, write values to an OPC Server, and get events from an OPC Server.
This flow provides examples that can serve as a foundation for an interactive OPC Client application built in Node-RED. This now concludes the OPC UA Series.
full source code for this project -
Discuss your use case with our team
See how FlowFuse can support your architecture, integrations, and deployment needs.
Table of Contents
- Custom Nodes Used & Assumptions
- Install and Deploy the Prosys OPC UA Simulation Server
- Objectives of the Node-RED OPC Client Dashboard Application
- Browse Hierarchical Server Address Space Structure With OPC UA Browser Node
- Read OPC UA Values Using OPC UA Browser Node
- Write OPC UA Values To Server Using OpcUa-Item and Opc-Ua-Client Nodes
- Read Alarms & Events from OPC UA Server Using OpcUa-Event and Opc-Ua-Client Nodes
- Using FlowFuse to Enhance Your Node-RED Application: Security, Scalability, and Robustness
- Conclusion
Related Articles:
- FlowFuse + LLM + MCP = Text Driven Operations
- The Industrial IoT Market Shift: What the PTC Divestment Means for Your Data Strategy
- MCP and Custom AI Models on FlowFuse!
- EtherNet/IP Integration with FlowFuse: Communicating with Allen-Bradley PLCs
- The Node-RED Revolution: How Low-Code is Democratizing Industrial Automation