CNC Machine Monitoring: Get More Output Before More Machines
Find where spindle hours go, put a cost on the losses and prove the gains on one cell

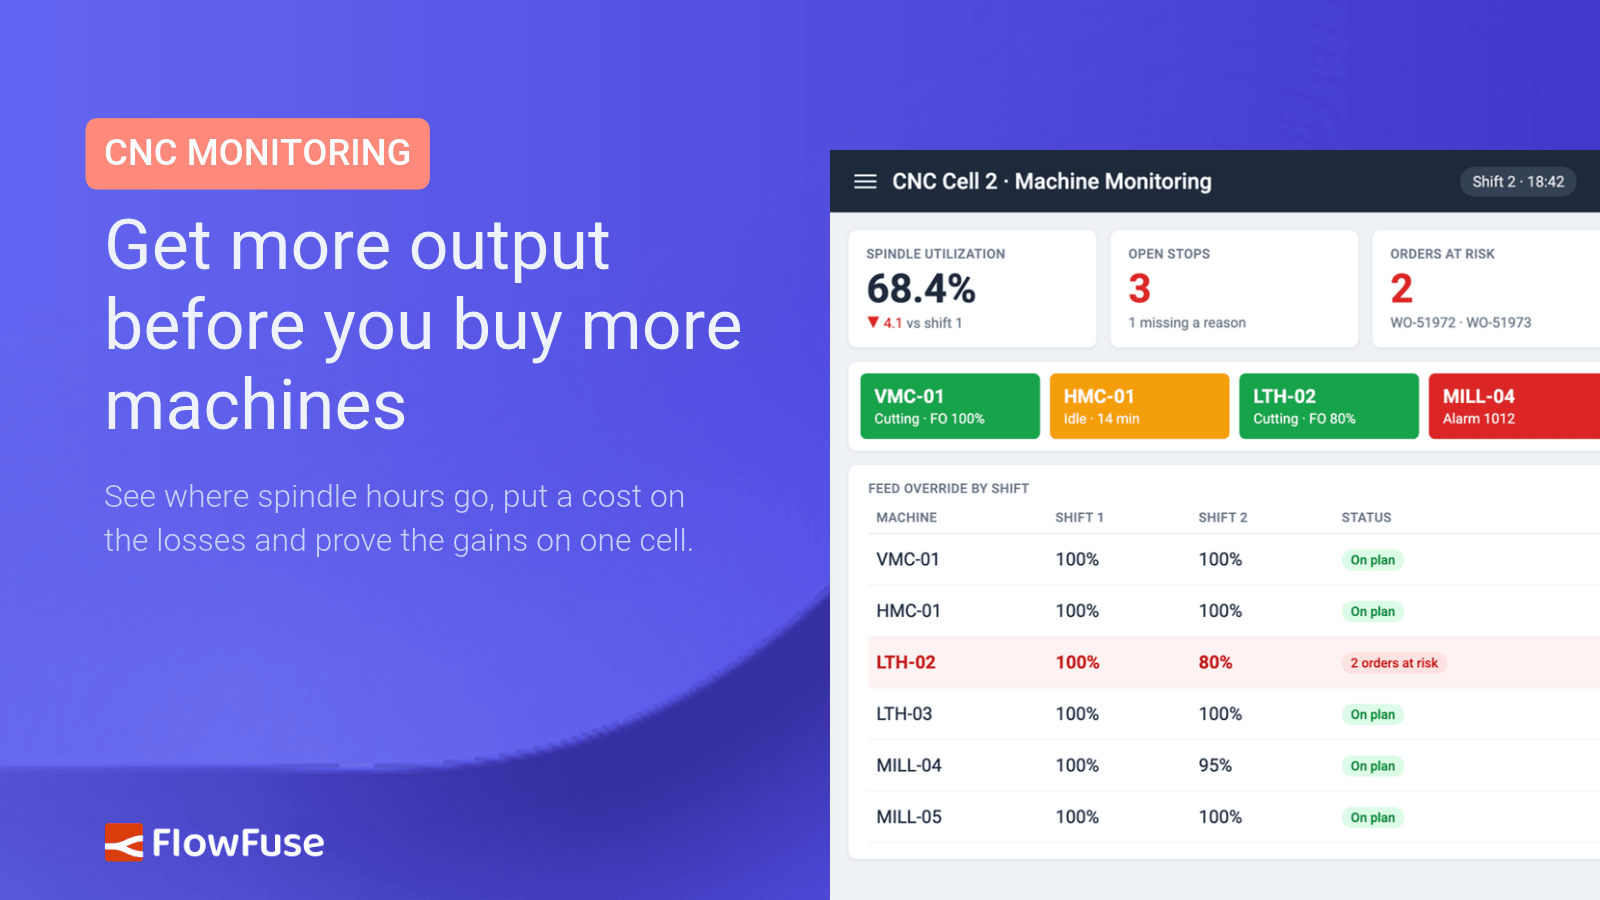
- Monitoring reads state, part counts and alarms from each controller, or from sensors on older machines, and operators add the reason for every stop.
- Put a price on lost hours with contribution per hour, recovery costs and repair costs, so finance can approve a monitoring deployment.
- Review the data at a set time each shift, day and week, and give every top loss an owner.
- Prove the gains on your bottleneck cell before buying another machine, then roll the same application out to every line and plant.
When a CNC cell can't keep up, the usual answer is another machine. Often the capacity is already on the floor. A machine scheduled for an eight-hour shift rarely cuts for eight hours: setups, material delays, tool changes and short stops take their share, and much of that time never reaches shift reports.
CNC machine monitoring makes those losses visible. It records what each machine is doing, how many parts it makes and why it stops, so you can see where the hours go and how much output you can recover before buying another machine.
Where CNC machine hours go
Modern Machine Shop's Top Shops benchmarking survey measures spindle utilization, the share of scheduled production time spent cutting. In a recent edition, the median shop cut for 65% of scheduled time, compared with 75% for leading shops.
The gap comes from two kinds of loss. Planned losses, such as setups and tool changes, appear in the schedule. Unplanned ones, such as material shortages, short stops and breakdowns, often go unrecorded, yet a ten-minute wait for material, repeated across machines and shifts, adds up to hours.
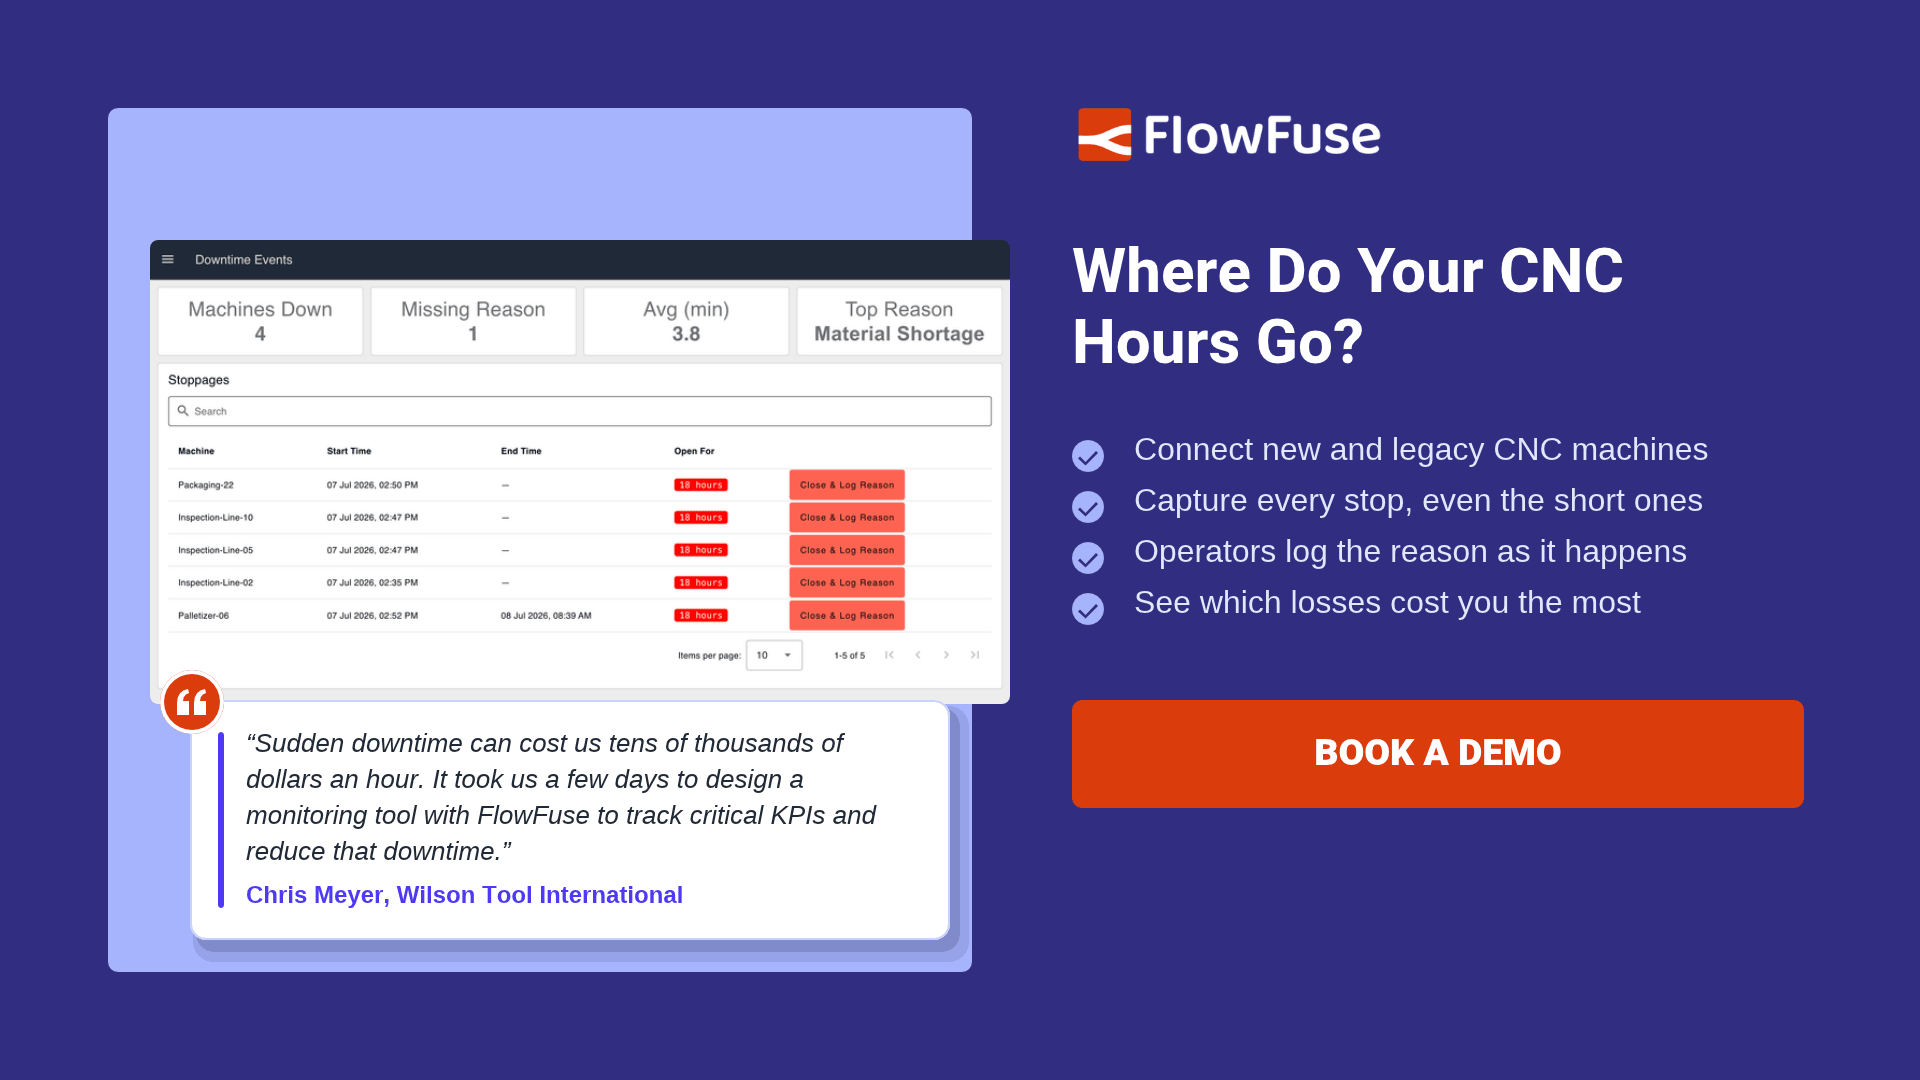
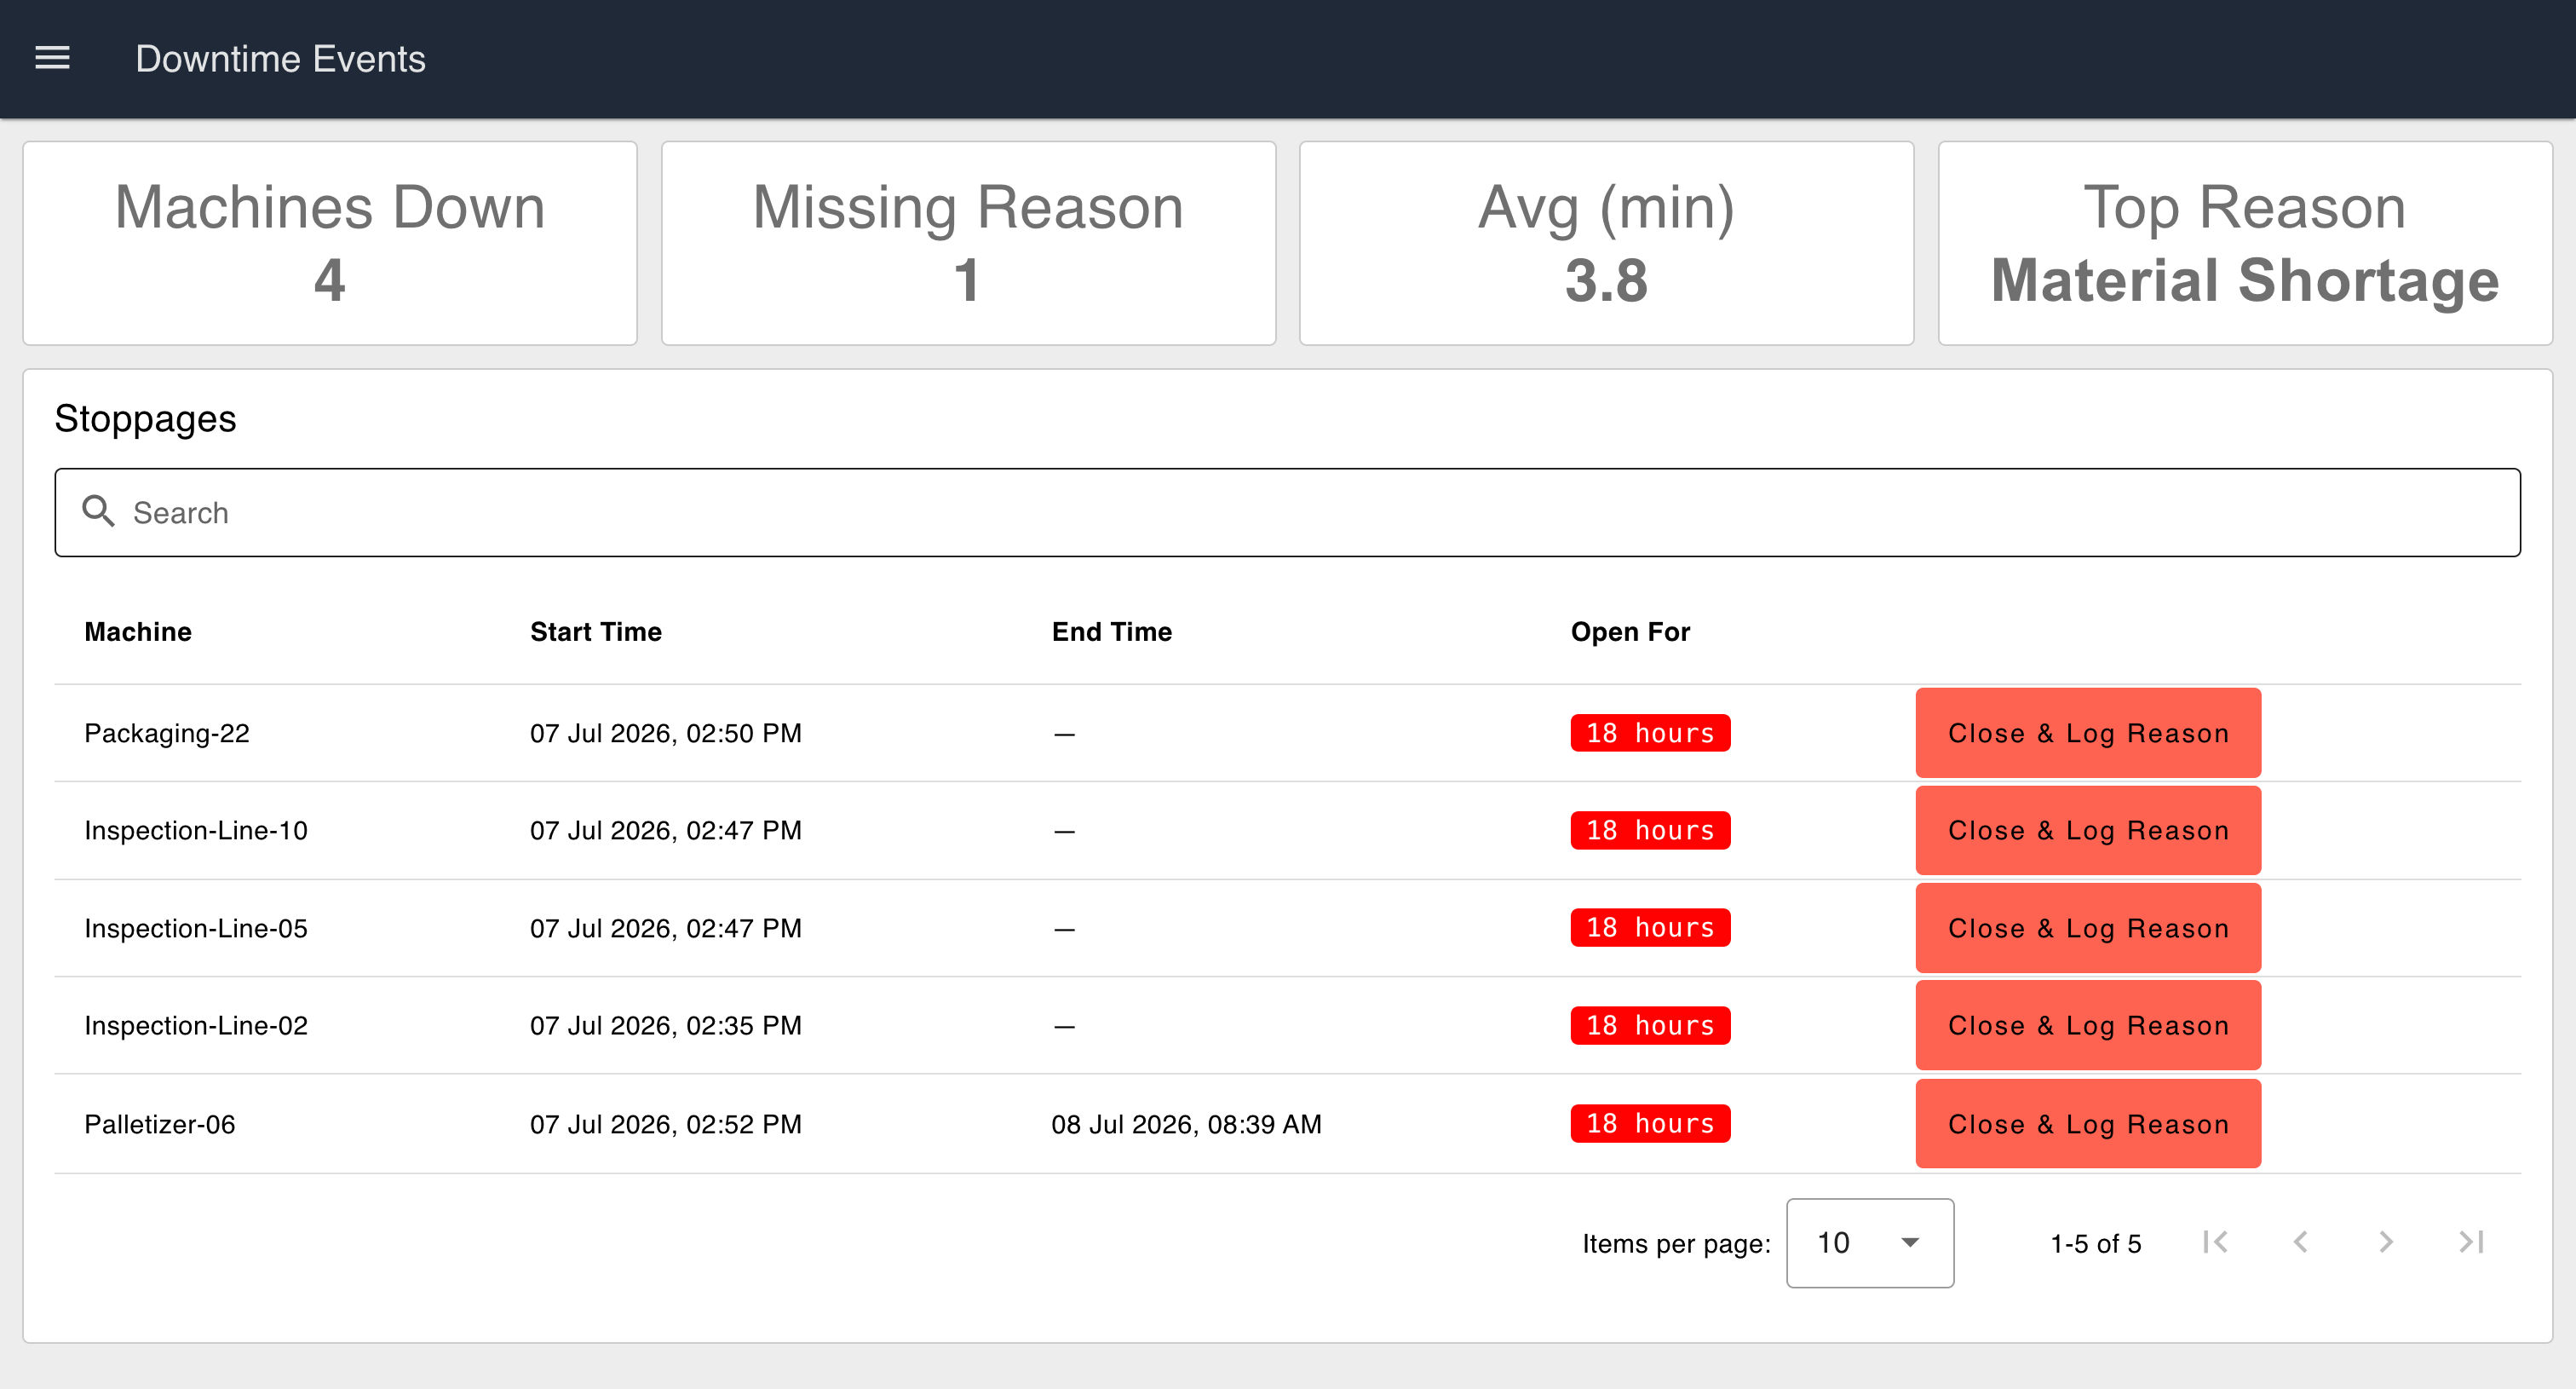
Monitoring records these stops automatically, but only the operator knows why each one happened. In the downtime logger we built with FlowFuse, a stop reported by the controller opens a record, and the operator picks the reason from six to eight options with one tap. The dashboard then ranks the most common reasons, so each loss goes to the team that can fix it.
How CNC machine monitoring works
Capturing those stops, and everything else a machine reports, takes four steps:
- Collect: Read states, part counts, alarms and spindle load from each machine.
- Add context: Tag each reading with the machine, job and shift.
- Store: Keep the history in a time-series database.
- Act: Show results on dashboards and alert the right team when a machine stops.
FlowFuse handles all four steps in one platform, and FlowFuse AI helps you dig into the data and build new views from it. In the demo below, it compares two shifts in a CNC cell, finds a machine running with a low feed override (the operator's feed rate setting) and adds a view to track it. The Build with AI playlist has more examples.
Collecting data from CNC machines
The first step depends on what each machine can report. Newer controllers share detailed data, and older machines report run, idle and alarm states through sensors that cost a fraction of a new machine, so you can monitor machines of any age.
| Controller or machine | Typical connection | What you get |
|---|---|---|
| Fanuc | FOCAS over Ethernet, or Fanuc's MTConnect option | State, part count, program, alarms, overrides |
| Haas, Mazak, Okuma, DMG MORI | MTConnect, built in or through an adapter | State, program, spindle speed and load, alarms |
| Siemens SINUMERIK, Heidenhain | OPC UA, usually a licensed option | State, program, axis and spindle data, alarms |
| Machines controlled by a PLC | Modbus or the PLC's native protocol | Whatever signals the PLC holds |
| Older machines with no network port | Stack-light tap, current sensor or digital I/O | Running, idle and alarm states, cycle counts |
FlowFuse connects all of them through an edge device, so older and newer machines feed the same dashboards. See all supported integrations.
Which CNC monitoring KPIs to track
Once data is flowing, start with three production KPIs:
| KPI | The question it answers |
|---|---|
| Machine state: cutting, idle, setup, alarm, off | How much scheduled time is spent cutting? |
| Parts produced and cycle time | Are machines meeting targets? Which jobs run long? |
| Downtime reason | Why did the machine stop, and who needs to act? |
Machine state gives you spindle utilization, the number to watch first:
Spindle utilization = Cutting time ÷ Scheduled production time × 100
Add ideal cycle times and scrap counts later, and the same data gives you OEE (Overall Equipment Effectiveness).
Once production data is reliable, add quality KPIs such as first-pass yield and scrap rate, because high utilization means little if the parts are scrap. For maintenance, track spindle load, temperature and alarm history. A rising spindle load often signals tool wear.
What lost CNC capacity really costs
These KPIs show where the hours go. Before finance approves a monitoring deployment, it will also want to know what those hours cost:
Cost of lost capacity = Lost hours × Contribution per hour + Recovery costs + Repair costs
Contribution per hour is what the lost parts would have earned after material and other variable costs. Recovery costs cover overtime, outsourcing and expedited freight. Repair costs cover parts, labor and service.
Take a machining center scheduled for 80 hours a week that loses 12 hours to short stops and waiting. At an illustrative US$150 contribution per hour:
12 hours × US$150 × 48 weeks = US$86,400 per year
That money is potential, not guaranteed: you only earn it if you have orders to fill the freed hours.
Breakdowns add recovery and repair costs. At one metals plant, a bearing failure took out a CNC chuck and kept the machine down for about eight weeks. At the same rate, that's US$96,000 in lost contribution, around US$20,000 in outsourcing and freight, and US$15,000 in repairs: about US$131,000 from one failure. The plant's monitoring only showed whether machines were on, so nobody saw the rising load that could have warned them about the bearing.
As the engineer leading the plant's preventive maintenance program put it:
"If I can show that one machine is losing production and how much it costs to repair, then I can justify everything."
To build your own case, fill in each term for one machine from your production, maintenance and finance records.
Turning machine data into daily action
A business case gets the deployment approved, but the data only recovers capacity when someone reviews it on a fixed schedule and leaves with a task:
| When | The question to answer | Action |
|---|---|---|
| During the shift | Which machines are down, and which stops still have no reason? | Clear the stop and log the reason |
| Daily production meeting | Which downtime reasons cost the most hours yesterday? | Give each top loss an owner and a due date |
| Weekly review | Is spindle utilization rising, and did last week's fixes hold? | Close finished actions and reopen the ones that slipped |
Before the first review, agree on what each machine state means, for example whether a warm-up cycle counts as cutting. Otherwise meetings turn into arguments about the numbers. Some stops can't wait for a meeting, so automate detection and escalation to alert maintenance the moment an alarm fires.
Proving it on your first cell
The simplest way to put all of this to work is to start with one cell. Pick the one limiting your output, since every hour recovered there creates an opportunity to ship more parts. Agree on what success looks like before deployment. Collect data for two to four weeks to establish a baseline, then tackle the biggest losses one at a time and calculate the value of the recovered hours.
If the results justify a wider rollout, use FlowFuse to scale the same application across more cells, production lines and plants, managed from one place. Walter started with a single FlowFuse instance and now runs more than 130 across its production units with the same seven-person IT team.
Before investing in another CNC machine, find out how much capacity your existing equipment can recover. Start with the bottleneck cell, establish a baseline and use machine data to identify the stops costing you the most production time. Once you've proved the gains, you'll have measurable results to guide your next production investment.
Recover Lost Spindle Hours Before You Buy Another Machine
Deploy a production monitoring application on your bottleneck cell, connected to your own machines and measured against a downtime target we set together. Your team runs it, and FlowFuse scales it to every cell and site.
Frequently Asked Questions
About the Author
Sumit Shinde
Technical Writer
Sumit Shinde is a Technical Writer at FlowFuse specializing in industrial automation and manufacturing. In the past three years, he has built industrial applications and authored more than 100 technical articles covering industrial connectivity, unified data architecture, production metrics, and quality management for modern manufacturing.
Like what you're reading?
Add FlowFuse as a preferred sourceOn the page that opens, check the box next to flowfuse.com to see more of our articles in your Google Search results.
Related Articles:
- FlowFuse Dashboard 1.31.0: Five Themes for a Dark Mode Dashboard
- 5 Manufacturing Dashboard Examples for Production, OEE & Quality
- Visual Layout Editor - Now Available in Dashboard
- Dialogs, Customizable Icons and Histograms Now Available in FlowFuse Dashboard
- New Layout, Widget and Gauges Now Available in FlowFuse Dashboard