-
FlowFuse Expert: Never Miss an Update
Cloud All tiersSelf-Hosted Enterprise (contact us)The Expert now shows a banner in the chat area when a newer version is available. One click and you are up to date.
FlowFuse Expert is updated regularly with new capabilities. This makes sure you always know when there is something new to try, without having to check manually.
For more details, see Keeping Expert up to date.
-
Set Node.js Options for Remote Instances
Cloud All tiersSelf-Hosted All tiersFlowFuse Device Agent v3.8.1 adds support for setting Node.js command line arguments for Remote Instances.
This allows things like:
- Setting the Node.js heap size for memory-intensive flows
- Enabling
--use-openssl-ca(Linux) or--use-system-ca(Windows and macOS) to use private CA certificates
Node.js options can be configured in two ways:
1. Via the device agent command line
Use the
--node-optionsargument. This argument may be specified multiple times:flowfuse-device-agent -c /opt/flowfuse-device-agent/device.yml \
--node-options='--max-old-space-size=256' \
--node-options='--use-openssl-ca'2. Via the
device.ymlfileAdd a
nodeOptionssection:deviceId: xxxxxxx
forgeURL: https://app.flowfuse.com
token: xxxxxxxx
credentialSecret: xxxxx
nodeOptions:
- '--max-old-space-size=256'
- '--use-openssl-ca'For more details, see Configuring Node.js Options.
-
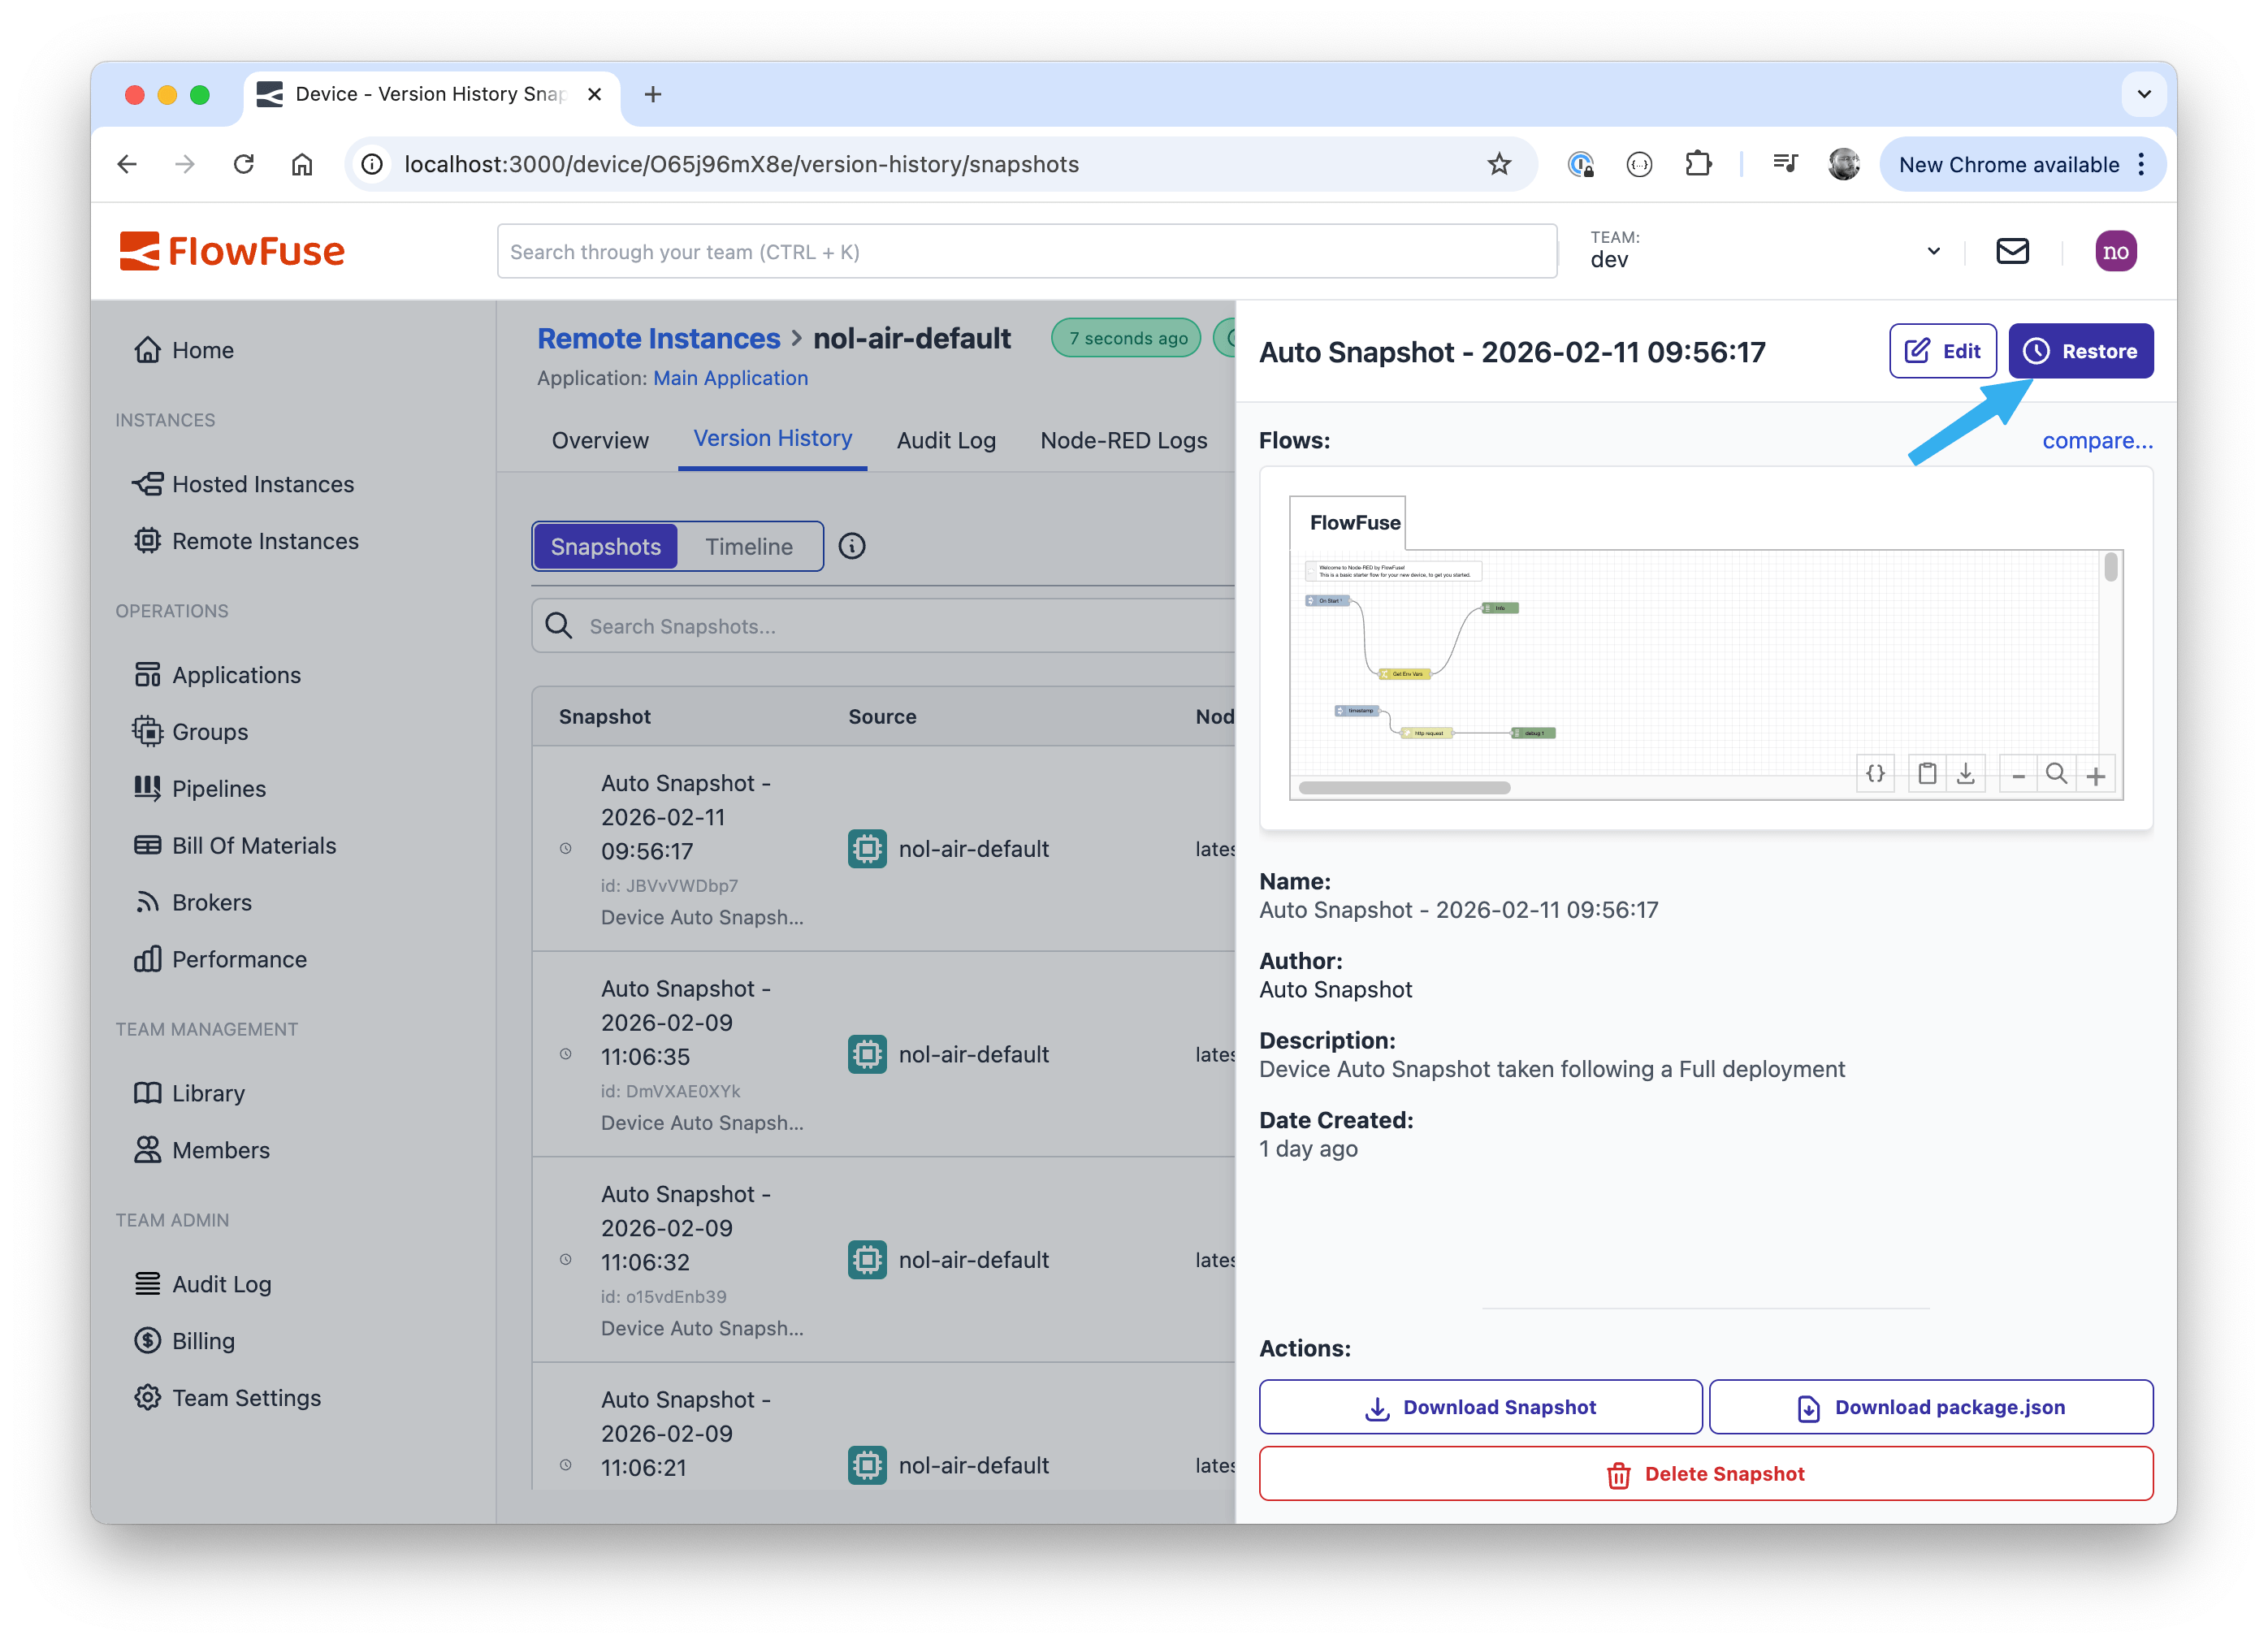
Device Agent version 3.8.0 has been released which brings a significant workflow improvement when editing your flows.
When the ability to remotely edit flows was introduced - known as 'developer mode' - we blocked the ability to push snapshots to a remote instance whilst in this mode. This protection makes sense when you're working on a remote instance, but still need to push updates out to the rest of your fleet through a pipeline deployment - you don't want the deployment from overwriting the work you're in the middle of.
However, there are cases where you want to rollback changes you've been making to a remote instance. Previously that would involve taking the instance out of developer mode, restoring the snapshot, then putting it back into developer mode to continue working. This is a lot of unnecessary steps and not an obvious workflow.
With the new v3.8.0 release of the Device Agent, it is now possible to manually restore snapshots without leaving developer mode:
- Open the Version History tab for the Remote Instance and switch the Snapshots view
- Click on the snapshot you want to use
- Click on the restore button in the snapshot sidebar
The existing protection that blocks pipeline-driven deploys of snapshots is still in place.
-
As part of FlowFuse v2.27.0 release the behavior of Hosted Node-RED instances with HA enabled has been updated to reduce the down time experienced.
Any action that triggers a restart of the Node-RED instance (manually triggered or as part of a Pipeline deploy) will now restart them in sequence rather than in parallel. This means that there should be no down time for this instance.
This feature is available to Enterprise Licensed Self Hosted users and Enterprise tier users of FlowFuse Cloud.
-
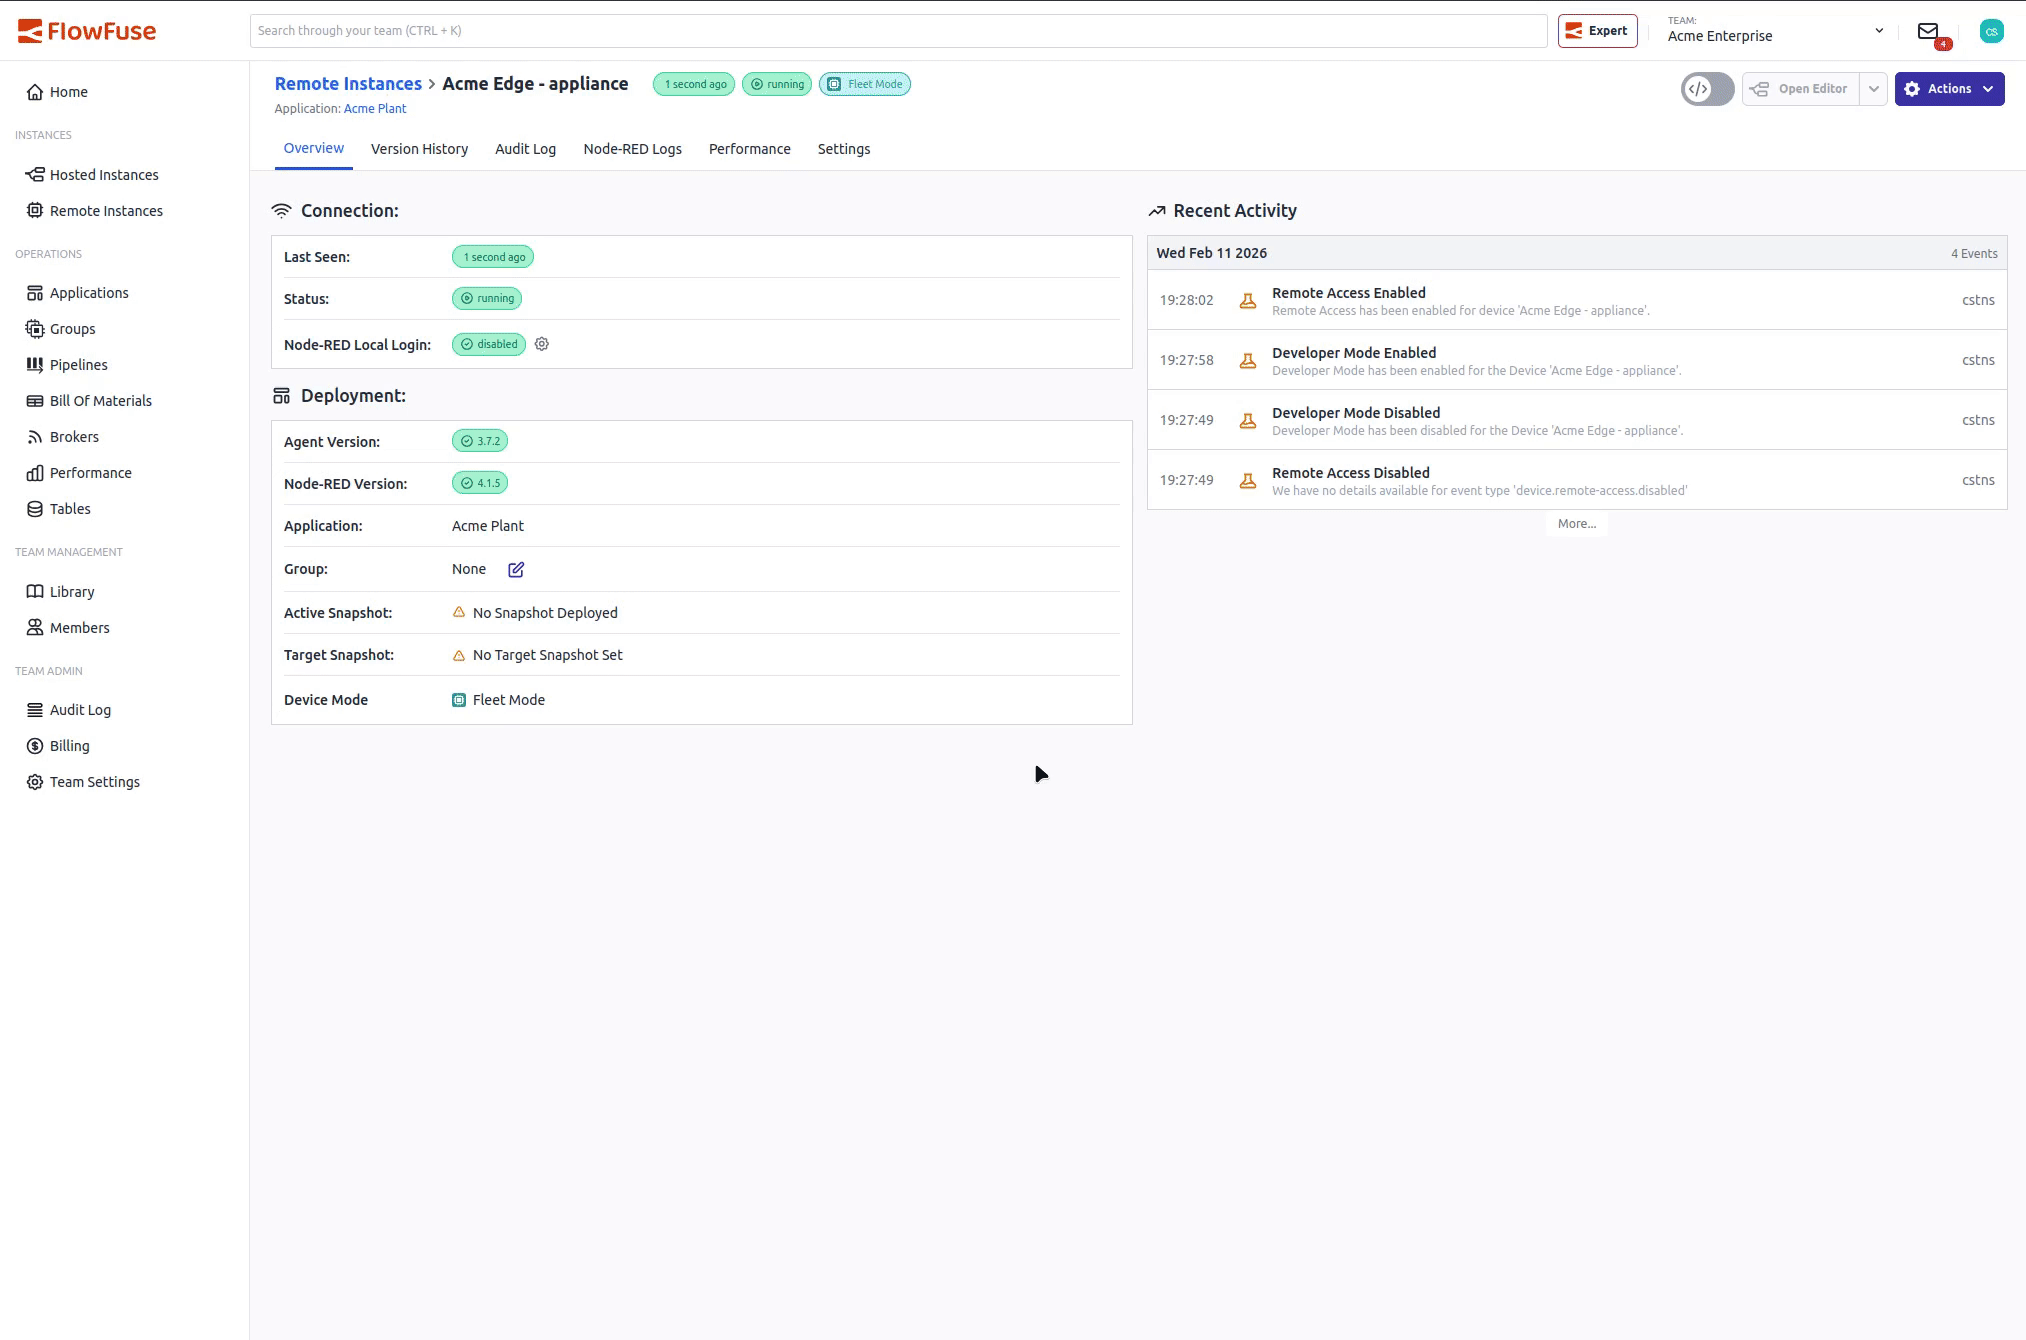
You can now access Immersive Mode when working with Remote Instances.
Immersive Mode gives you at-a-glance instance stats alongside the editor, while also enabling the FlowFuse Expert to help speed up development and debugging, especially when you’re working on the edge with remote devices.
Prefer the classic experience? The existing plain connection flow is still available: clicking the Open Editor dropdown selector includes an alternative option to be able to open the editor in the non-immersive mode.
-
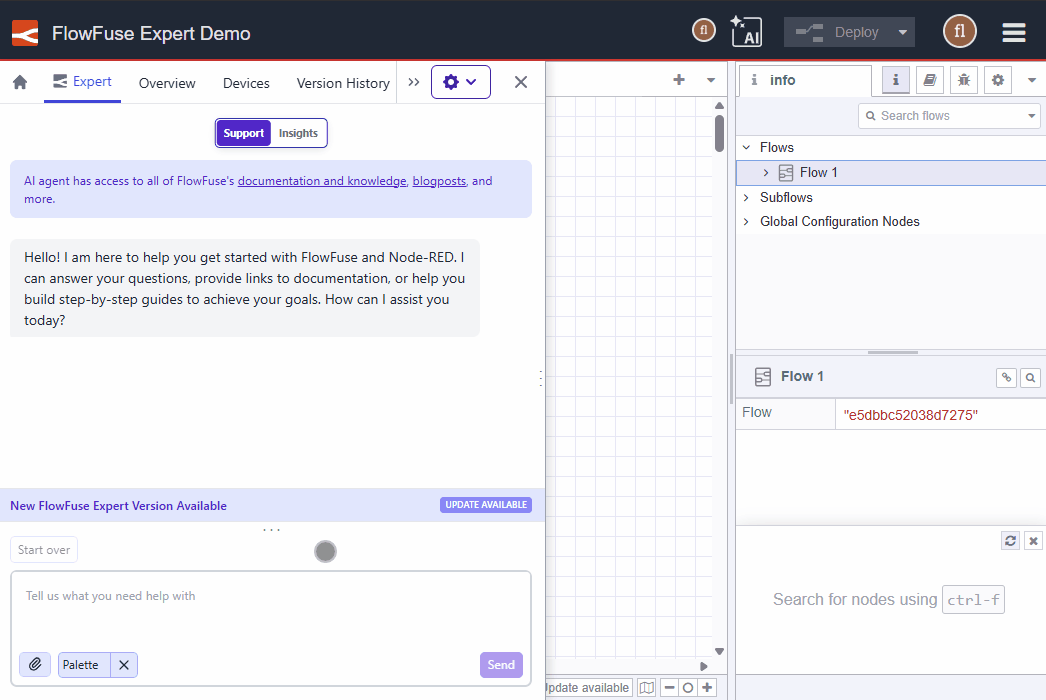
We are continuing to evolve the FlowFuse Expert by giving it deeper integration into your Node-RED environment. Starting today, the Expert has Palette Awareness.
You can now ask the Expert about your installed nodes, versions, and available updates without leaving the chat interface or needing to manually input said context. For example:
- Do I have any nodes installed that can send Emails?
- Are my palette nodes up to date?
- Are any nodes on my palette disabled?
- Can you suggest a node package that would replace this complex function code?
- or any question related to your palette.
This is one of several steps we are taking to bring additional context directly into your FlowFuse Expert to augment its capabilities and improve your workflow.
-
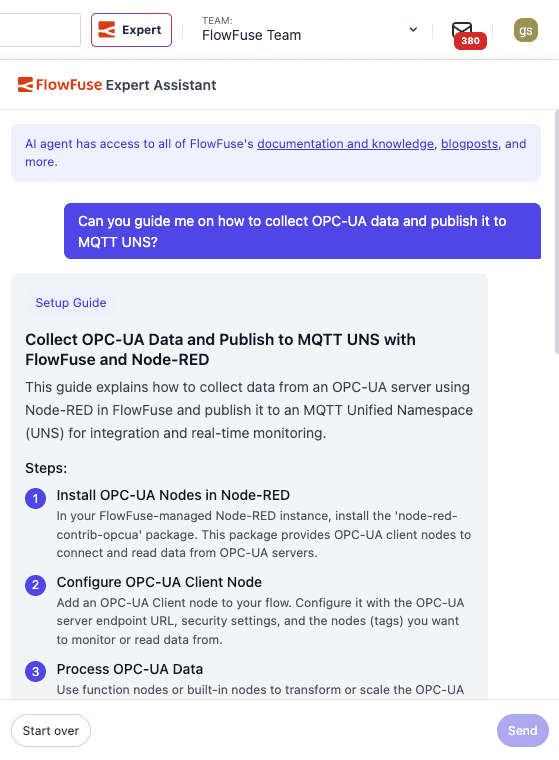
Need help with a specific flow?
The FlowFuse Expert now has the ability to include your flow selection as context, allowing you to ask specific questions about your logic and configuration.
We are continuously adding new features to improve your development workflow, with more updates for the FlowFuse Expert on the horizon. We hope this makes your building experience even smoother.
-
We have started to see some Node-RED nodes dropping support for NodeJS v18. This is causing problems for users of our Device Agent docker container as that is still based on NodeJS v18.
To help move things forward, with the v3.7.2 release of the Device Agent, we are now publishing separate container images for both v18 and v20 under different tags.
The
latesttag will continue to point to the NodeJS v18 version for now for backwards compatibility. The next major release of the device agent will update thelatesttag to a newer NodeJS version - and may require a migration step if you are using the module cache feature. We'll share more details when that release arrives.With this update, the following tags are now available:
NodeJS 18
- flowfuse/device-agent:latest
- flowfuse/device-agent:latest-18
- flowfuse/device-agent:v3.7.2
- flowfuse/device-agent:v3.7.2-18
NodeJS 20
- flowfuse/device-agent:latest-20
- flowfuse/device-agent:v3.7.2-20
-
The FlowFuse Expert recently gained the ability to suggest and install node packages directly within your workflow (see our previous post on FlowFuse Expert: Integration with Node-RED).
Today, we've streamlined this experience. The Expert now detects if a suggested node is already present in your instance. Instead of a showing the "Install" button, you’ll now see a "Manage" button that takes you directly to the Palette Manager.
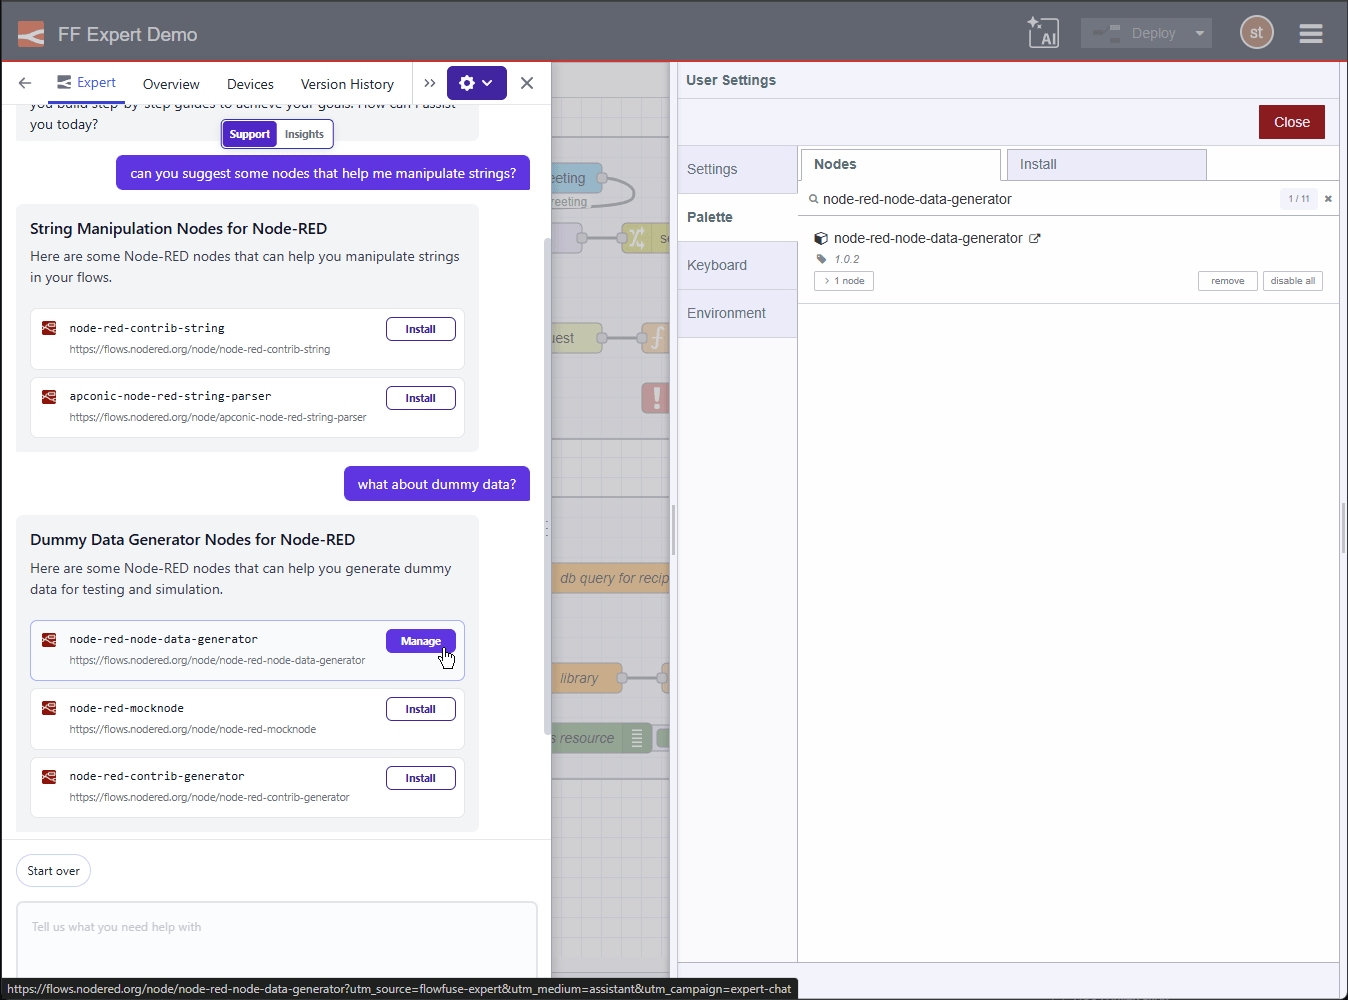
This improvement reduces friction when updating or configuring your existing nodes. These workflow integrations are just the beginning of our plans for the FlowFuse Expert. We're excited to see how much time they save you!
-
FlowFuse Expert Insights just got a little bit better.
What is FlowFuse Expert Insights?
In case you are new to this feature, checkout out some of our previous blog posts:
What's new?
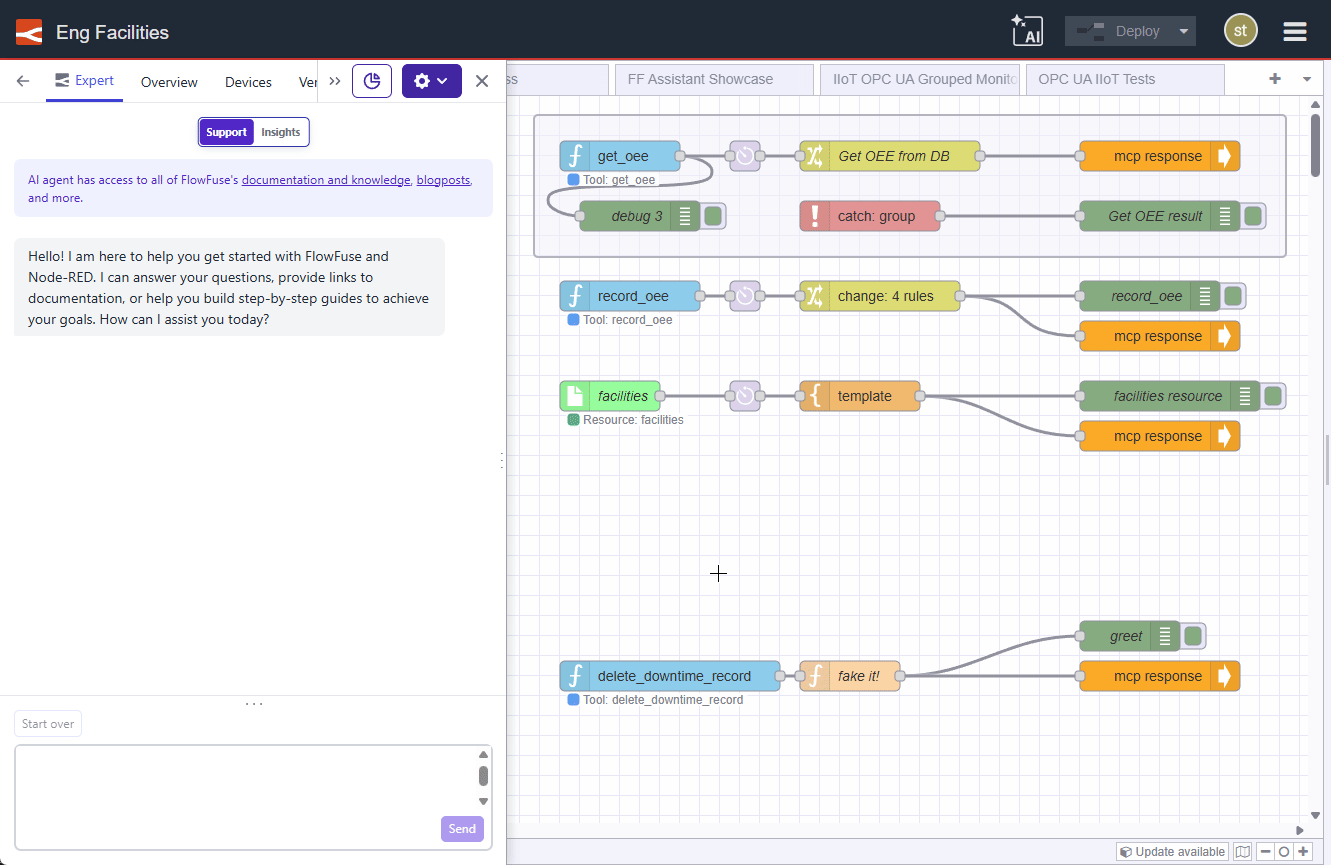
With this update, the MCP servers you protected behind FlowFuse User Authentication can now be accessed and queried in the FlowFuse Expert too.
Note: The FlowFuse Expert Insights feature is currently in Beta. We are actively expanding its capabilities. We would love to hear how you are using MCP to extend your systems.
-
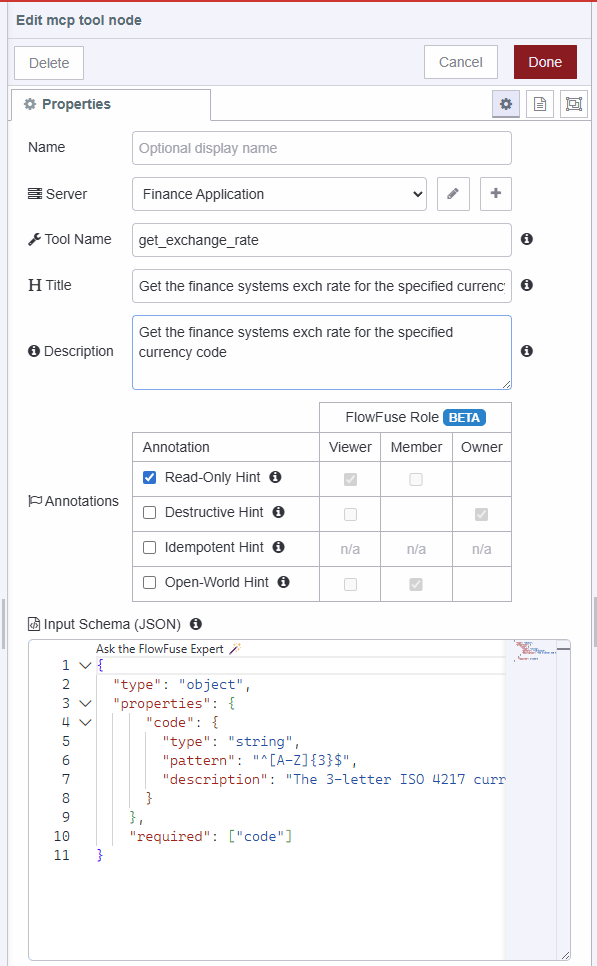
Following on the the introduction of FlowFuse Expert MCP-Powered Insights we have added annotations to the FlowFuse MCP nodes and linked them up with the FlowFuse roles. This permits a level of control over who can access what. This is just a first step, we will be working in the area over the next few iterations.
MCP Tools Node
To facilitate a level of role based access control in the Expert, we have leveraged the new Granular RBACs and MCP annotations to introduce 2 means of filtering and control:
- By application - as introduced in FlowFuse 1.5
- By pre-defined role level mapping to the annotation hints. For instance, users with a 'Viewer' role will only be exposed to tools marked with the Read Only hint, while Destructive tools are reserved for 'Owners'. The screenshot below indicates more clearly what this mapping is.
To facilitate this, we have the next version of our (MCP Server Nodes)[https://flowfuse.com/node-red/flowfuse/mcp/] will introduce the 4 MCP standard annotations:
- Read Only Hint: Lets the MCP Client know that the tool is read-only and does not modify any data or state. This hint can be used by LLMs to understand that invoking this tool will not have side effects, making it safe for exploratory queries or information retrieval.
- Destructive Hint: Lets the MCP Client know that the tool performs destructive actions that may modify or delete data. This hint can be used by LLMs to exercise caution when invoking this tool, as it may have irreversible effects.
- Idempotent Hint: Lets the MCP Client know that the tool is idempotent, meaning that multiple invocations with the same parameters will have the same effect as a single invocation. This hint can be used by LLMs to understand that it is safe to retry or repeat calls to this tool without causing unintended side effects.
- Open World Hint: Lets the MCP Client know that the tool operates in an open-world context, meaning it may interact with external systems or data sources beyond the immediate environment. This hint can be used by LLMs to understand that invoking this tool may involve uncertainties or dependencies on external factors.
These annotations are not exclusive to FlowFuse or FlowFuse Roles, they also are useful for your own Agents and LLMs.
Note: Hints do not enforce behavior. The actual behavior of the tool depends on how it is used in your flows
Note: This feature is currently in Beta. We are actively expanding these capabilities and would love to hear how you are using MCP to extend your systems.
-
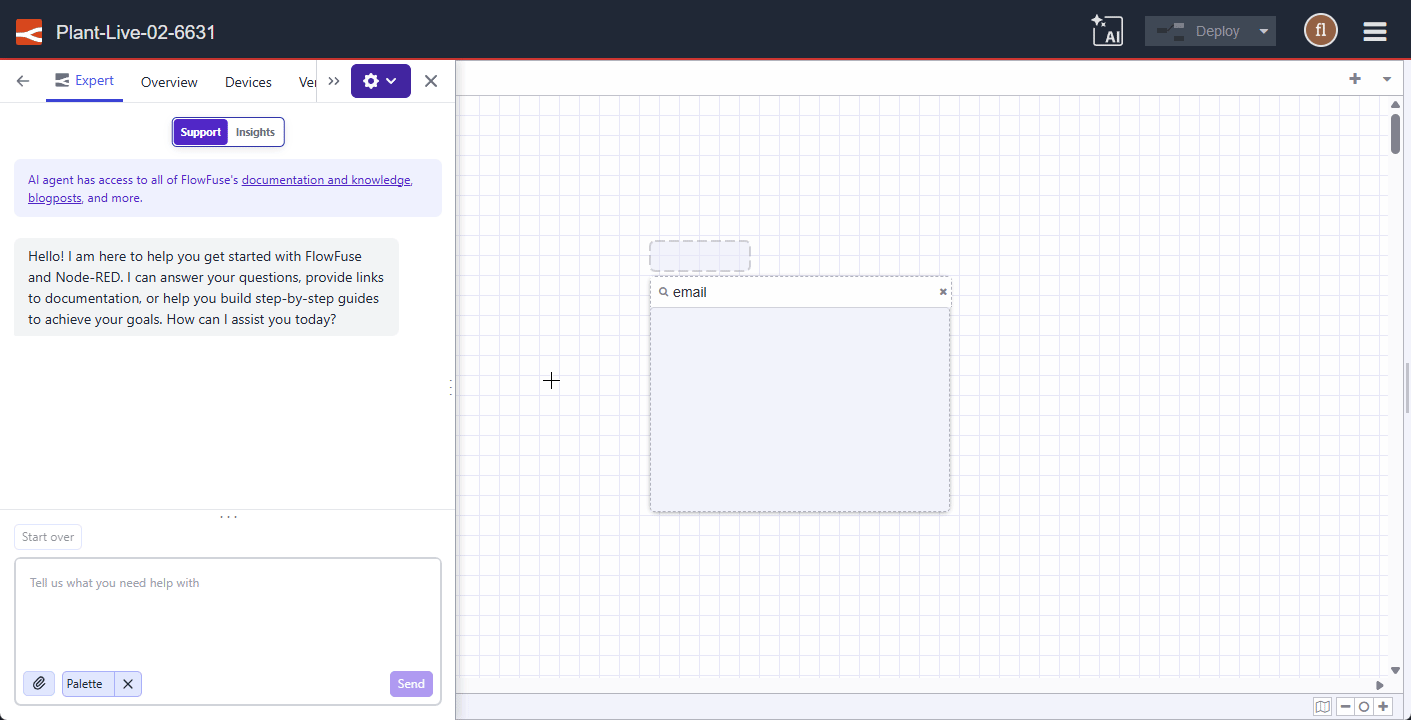
The FlowFuse Expert just got a lot more hands-on with your Node-RED editor:
- Streamlined Node Installation: When the Expert suggests a node module, it can now automatically open the Palette Manager and filter for the correct package, leaving you just one click away from installation.
- Direct Flow Imports: When the Expert provides demo flows, you no longer need to copy-paste JSON. The Expert can now inject those flows directly into your editor, ready for deployment.
These workflow integrations are just the start of our plans for the FlowFuse Expert. We’re excited to see how much time these save you!
-
Included in the FlowFuse 2.25.0 release is the ability to schedule times and days of the week for Hosted Node-RED instances to upgrade to the latest available version.
This ensures that fixes and security updates are applied promptly.
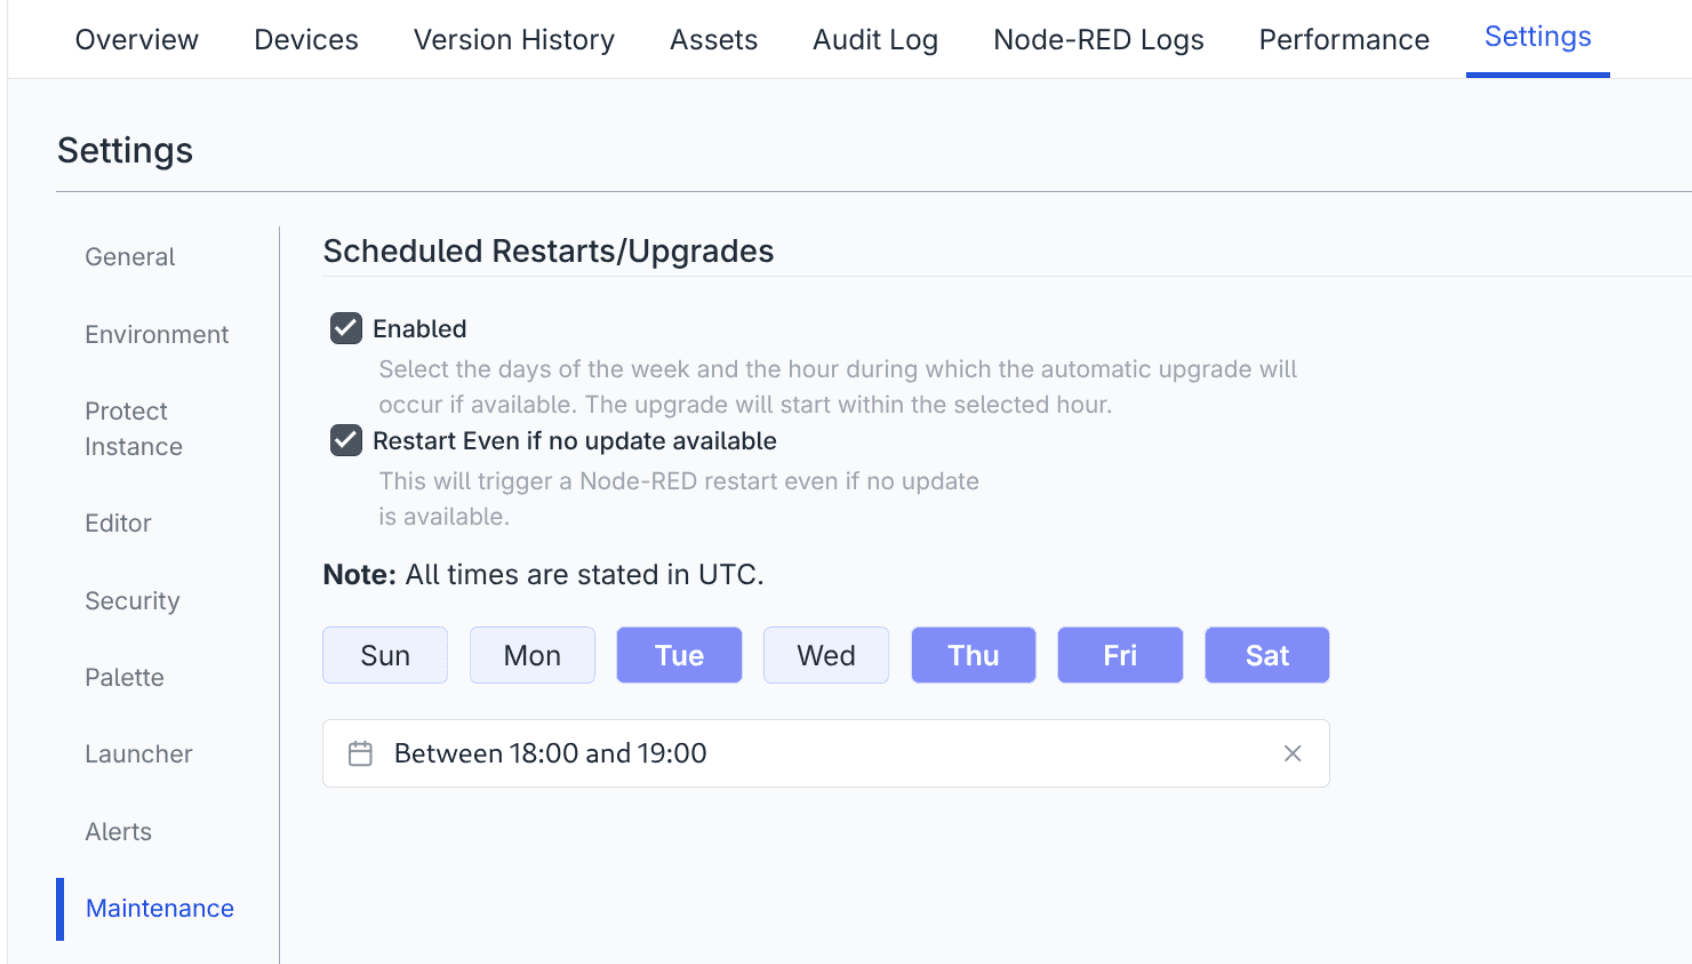
You can select multiple days of the week and an hour of the day the update will take place. The restart will be targeted in the first 30 minutes of the selected hour.
As well as scheduling upgrades, you can also enable scheduled restarts even if not update is available which may be useful to help with ensuring things run smoothly.
Self Hosted users can configure default restart/upgrade times at a TeamType level, FlowFuse Cloud Starter Tier users will have this enabled by default and it will run, at weekends.
-
Recently, we introduced MCP Server nodes which gave you the ability to infuse your Node-RED flows and data with AI. Today, we have given the FlowFuse Expert new powers by adding support for Model Context Protocol (MCP). This allows you to interact directly with your instances, tools, and data.
Bridging the Gap Between AI and Your Data
By switching to the new Insights mode, the Expert gains the ability to use the MCP tools and resources you’ve built using FlowFuse MCP Server Nodes. This means you can now ask the Expert to analyze real-time data from your flows, query external databases, or trigger specific actions across your infrastructure.
How to get started:
- Deploy MCP Nodes: Add MCP Tools or Resources to your Node-RED flows using our MCP Server nodes.
- Switch to Insights: Open the FlowFuse Expert interface and use the Mode Selector to switch from "Chat" to "Insights."
- Select your Server: Choose the MCP Server you want to include in your session.
- Gain Insights: Ask questions about your live process data, system status, or connected databases.
Give it a try and see what your data has to tell you!
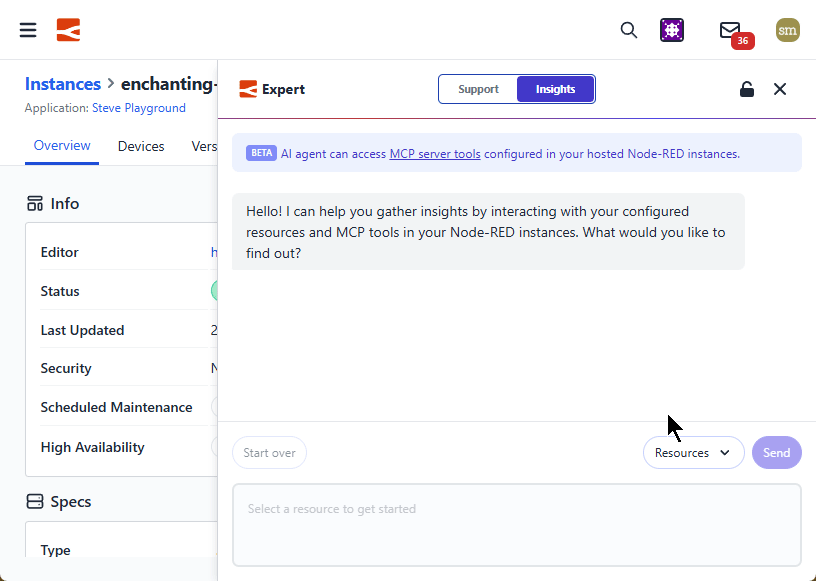
Note: This feature is currently in Beta. We are actively expanding these capabilities and would love to hear how you are using MCP to extend your systems.
-
FlowFuse v2.24.0 requires Node.js v20 or higher. If you are running an older version, you will need to upgrade Node.js before updating FlowFuse.
Node.js v18 reached end of life in April 2025 and no longer receives security updates. This change ensures FlowFuse continues to run on a supported and secure runtime.
To check your current version, run
node --version. -
The FlowFuse Expert just got a major improvement: you can now start a conversation on the flowfuse.com homepage and continue it inside of FlowFuse and the Node-RED editor!
Now, when you use the Expert, you can bring your application-building instructions with you as you navigate.
This work involved major and important changes to the Expert UI, and brings us even closer to being able to build Node-RED flows using natural language inputs.
Give it a try!
-
Customers on FlowFuse Cloud can now request custom Session Life times and Idle times. This allows the default times to be adjusted to match any in house policies that may be in place.
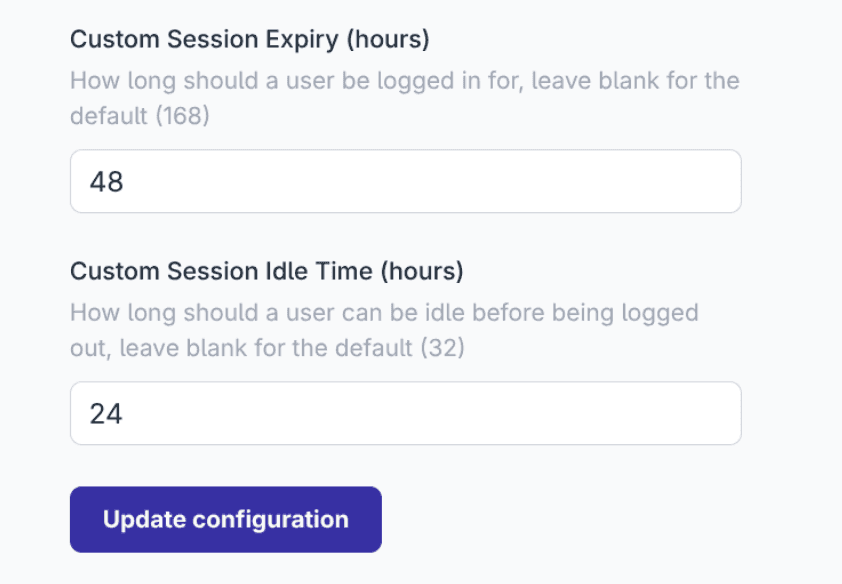
For existing FlowFuse Cloud customers please contact support if you would like to make changes to you existing configuration.
This will be available to Self Hosted customers in v2.24.0
-
As of today, you can now duplicate a hosted instance into a different application within your team.
It is a small (but important) improvement that just just makes things that little bit easier.
-
Managing device groups for multiple Remote Instances is now easier to handle. Bulk management already existed but was difficult to use efficiently at larger scale.
This update refines that process. You can select multiple Remote Instances from the team or application remote instances pages and bulk assign them to device groups with fewer steps.
The improved workflow reduces friction when organizing devices by location, environment, or function.
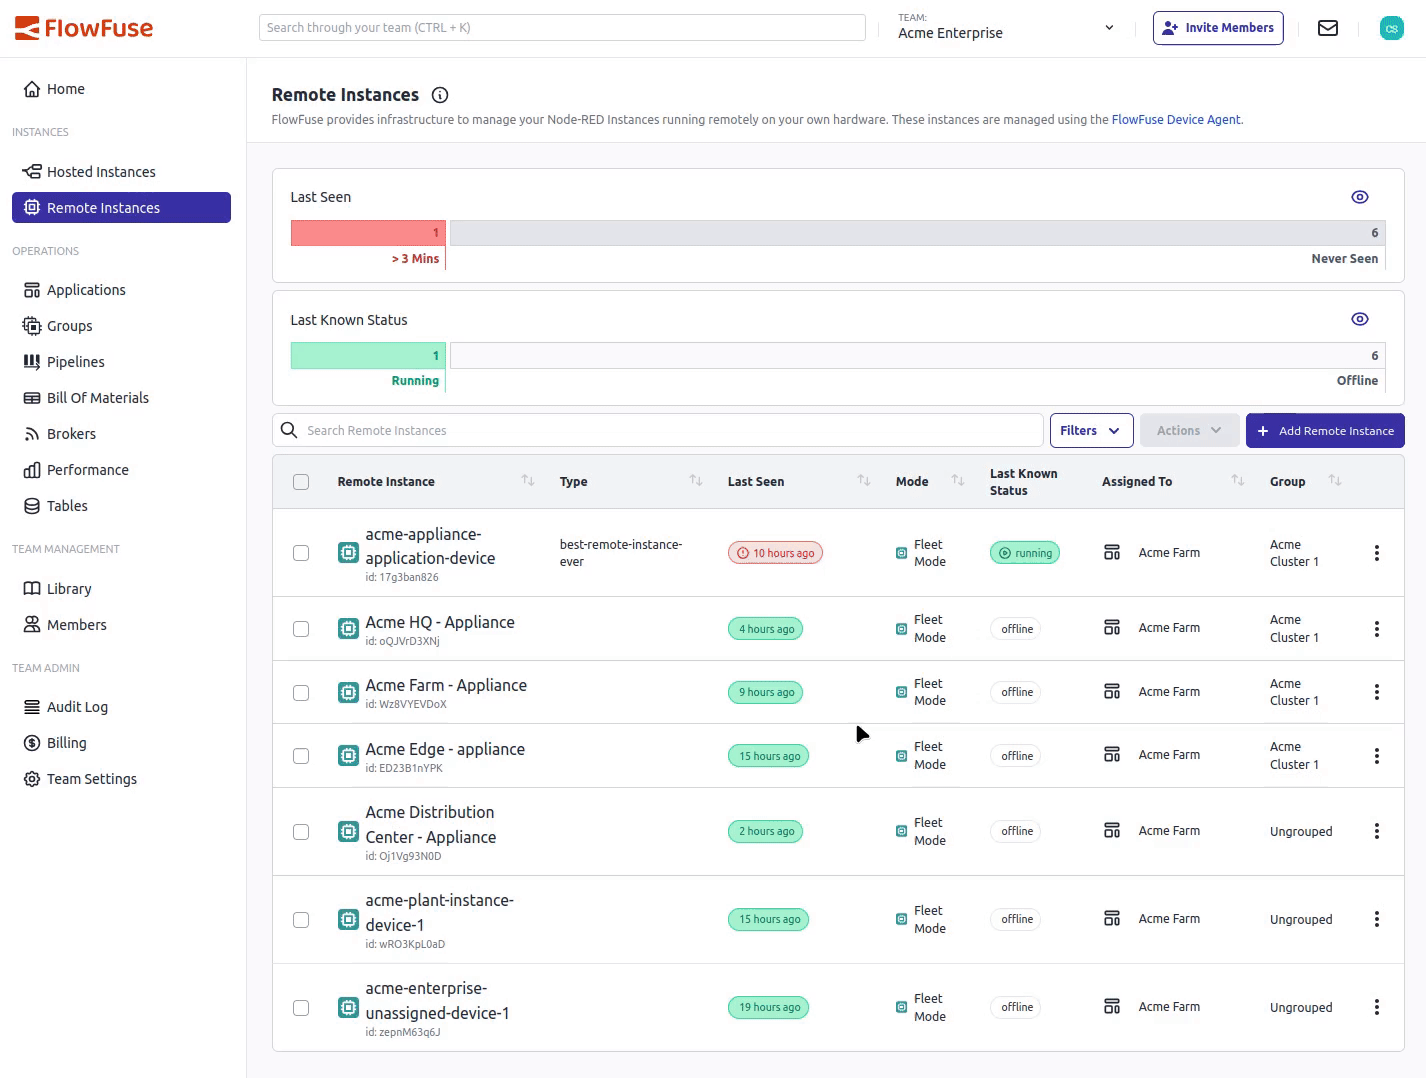
Bulk Device Group Management showing multi-select capabilities and group assignment options
Join us at Hannover Messe 2026
- Live demos + hands-on workshop with Nick O'Leary
- 12 short talks on real industrial use cases
- Limited spots