Part 2: Building an Andon Task Manager with FlowFuse
Step-by-step guide to building a real-time issue reporting and task tracking system using FlowFuse.
In Part 1, we introduced the concept of an Andon Task Manager—designed to streamline issue reporting and resolution on the factory floor—and outlined the system’s key features, user roles, and dashboard layout.
In this part 2, we move from planning to implementation. The focus now shifts to building the actual system using FlowFuse Dashboard (Node-RED Dashboard 2.0), hosted on the FlowFuse platform. We will begin by developing the Lines view for regular users, along with a line selection menu. The Department View and Admin interface will follow in a later part of the series.
Getting Started
To simplify the development process, the implementation is divided into the following key sections:
- Initialize SQLite Database
- Seed Demo Data: Departments & Lines
- Build Line Selection Menu
- Enable URL-Based Dashboard Access
- Create Live Request Fetch Flow (Per Line)
- Render Request Data in a Table
- Setting Up Visual Alerts and Timestamp Formatting
- Highlight Requests with CSS & Add Buttons to Update Request Status
- Create New Request Submission Flow
Before proceeding, a basic understanding of Node-RED is recommended. If you are new to Node-RED, consider going through this free Node-RED Fundamentals Course to get started.
Tip: Organize your flows into clearly defined groups. For reference, images of each flow are provided. Please use the exact names given to each flow—this will help ensure consistency and make it easier to navigate back to specific flows when referenced later.
Prerequisites
Before you begin building the Andon Task Manager with FlowFuse, make sure you have the following:
- Running FlowFuse Instance: Make sure you have a FlowFuse instance set up and running. If you don't have an account, check out the free trial and learn how to create an instance.
- @flowfuse/node-red-dashboard: Ensure you have FlowFuse Dashboard (also known as Node-RED Dashboard 2.0 in the community) installed.
- SQLite Contrib Node: Install
node-red-contrib-sqliteto handle local data storage. - FlowFuse Multi-user Andon: Install
@flowfuse/node-red-dashboard-2-user-addonto enable multi-user support. - Enable FlowFuse User Authentication: Enable FlowFuse User Authentication on your FlowFuse instance.
- Moment Contrib Node: Install
node-red-contrib-momentfor date and time formatting.
Initialize SQLite Database
The first step is to set up a database to store requests and their updates.
-
Drag an Inject node onto the canvas and configure it to trigger on Deploy, after a delay of 0.1 seconds.
-
Drag an SQLite node onto the canvas. Double-click and click the + icon to add a new database configuration.
-
Give the database a name and set the mode to Read-Write-Create. Click Add to save.
-
Set SQL Query to Fixed statement and enter:
CREATE TABLE IF NOT EXISTS requests (
  rowid INTEGER PRIMARY KEY,
  line TEXT NOT NULL,
  support TEXT NOT NULL,
  requested TEXT NOT NULL,
  acknowledged TEXT,
  resolved TEXT,
  notes TEXT
); -
Connect the Inject node to the SQLite node.
-
Click Deploy.
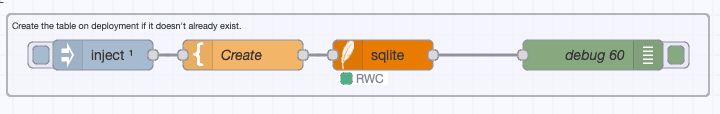
Once deployed, this will create the SQLite database and requests table if it does not already exist.
Seed Demo Data: Departments & Lines
As discussed in the planning section, only the admin role will have the ability to add new departments and lines. Since the admin feature is not yet available, we will populate demo data using a predefined flow to allow ourself to test the application while the standard user interface is being developed.
- Import the provided demo flow.
- Deploy the flow.
This will store demo lines and departments in the global context as global.lines if not already present.
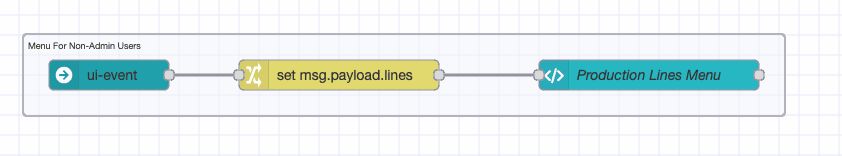
Build Line Selection Menu
Now, let us create a new page and menu item for Production Lines. This page will list all currently available production lines, making it easier to navigate through them.
- Drag a ui-event node onto the canvas to detect page navigation.
- Drag a change node and configure it to:
- Set
msg.payload.linestoglobal.get("lines")
- Set
- Drag a ui-template node onto the canvas. Create a new page with name “Line Menu” and a group.
- Paste the following into the template:
<template>
  <v-container>
    <v-row>
      <v-col>
        <h3>Production Lines</h3>
      </v-col>
    </v-row>

    <v-row class="scrollable-row" no-gutters>
      <v-col v-for="(btn, index) in lines" :key="index" cols="auto">
        <v-btn :href="`/dashboard/lines?line=${btn.value}`" class="custom-btn" rounded>

        </v-btn>
      </v-col>
    </v-row>

    <v-alert v-if="selectedLine" type="success" class="mt-3">
      Selected Line:
    </v-alert>
  </v-container>
</template>

<script>
export default {
  data() {
    return {
      selectedLine: '',
      lines: []
    };
  },
  methods: {
    updateButtonContent(data) {
      this.lines = (data.lines || []).sort((a, b) => a.label.localeCompare(b.label));
    }
  },
  mounted() {
    this.lines = [];
    this.$socket.on('msg-input:' + this.id, (msg) => {
      this.updateButtonContent(msg.payload);
    });
  }
};
</script>

<style scoped>
.scrollable-row {
  display: flex;
  overflow-x: auto;
  padding: 10px 0;
  flex-wrap: wrap;
}
.scrollable-row .v-col {
  flex-shrink: 0;
  margin-bottom: 10px;
}
.scrollable-row {
  min-height: 60px;
}
.custom-btn {
  background-color: rgb(32, 44, 52) !important;
  color: white !important;
  margin-right: 12px;
  padding: 8px 16px;
}
.custom-btn:hover {
  background-color: rgb(54, 70, 86) !important;
}
</style>- Deploy the flow.
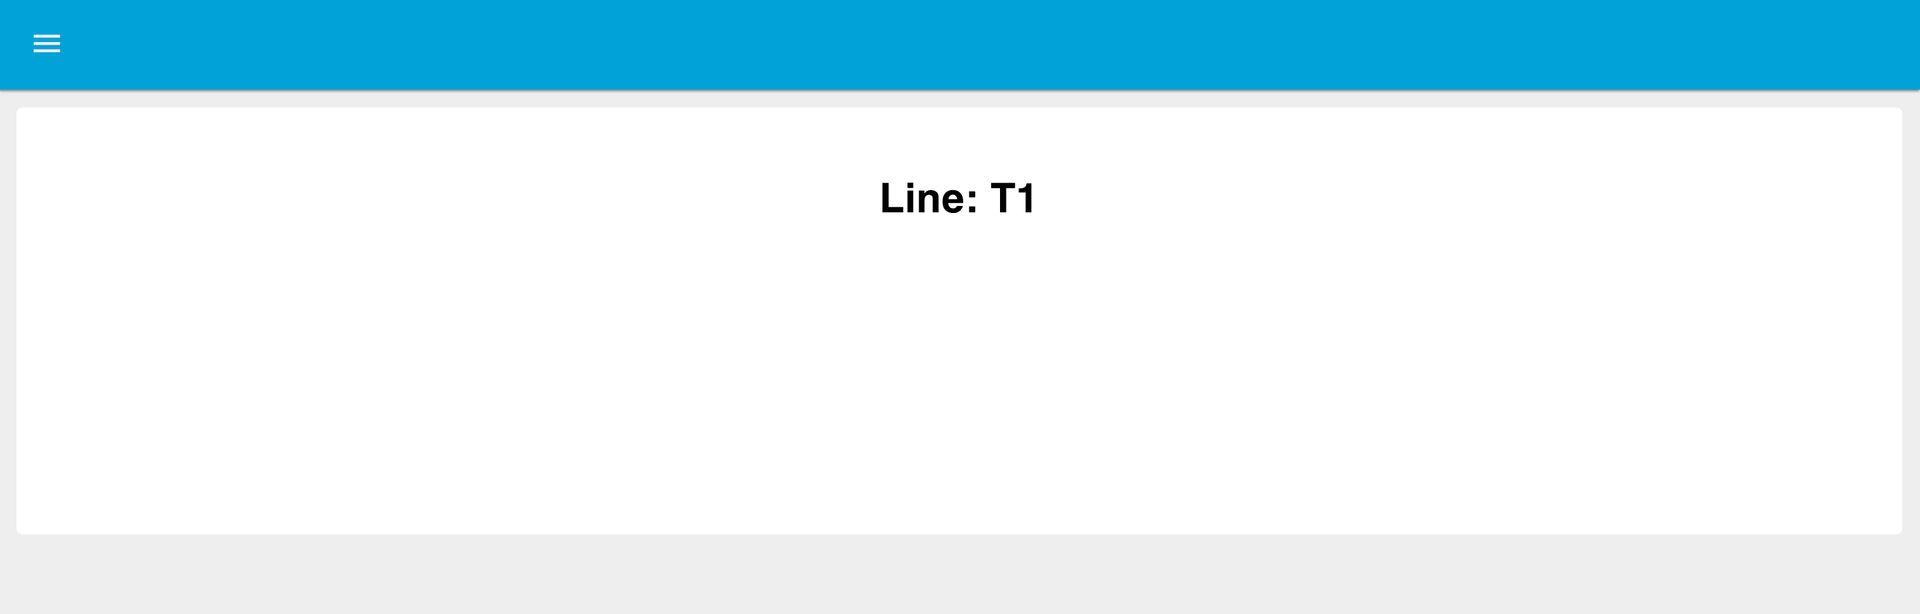
Once deployed, the dashboard will show buttons for each production line. Clicking a line redirects the user to a page with following url:
https://<your-instance-name>/dashboard/lines?line=T1
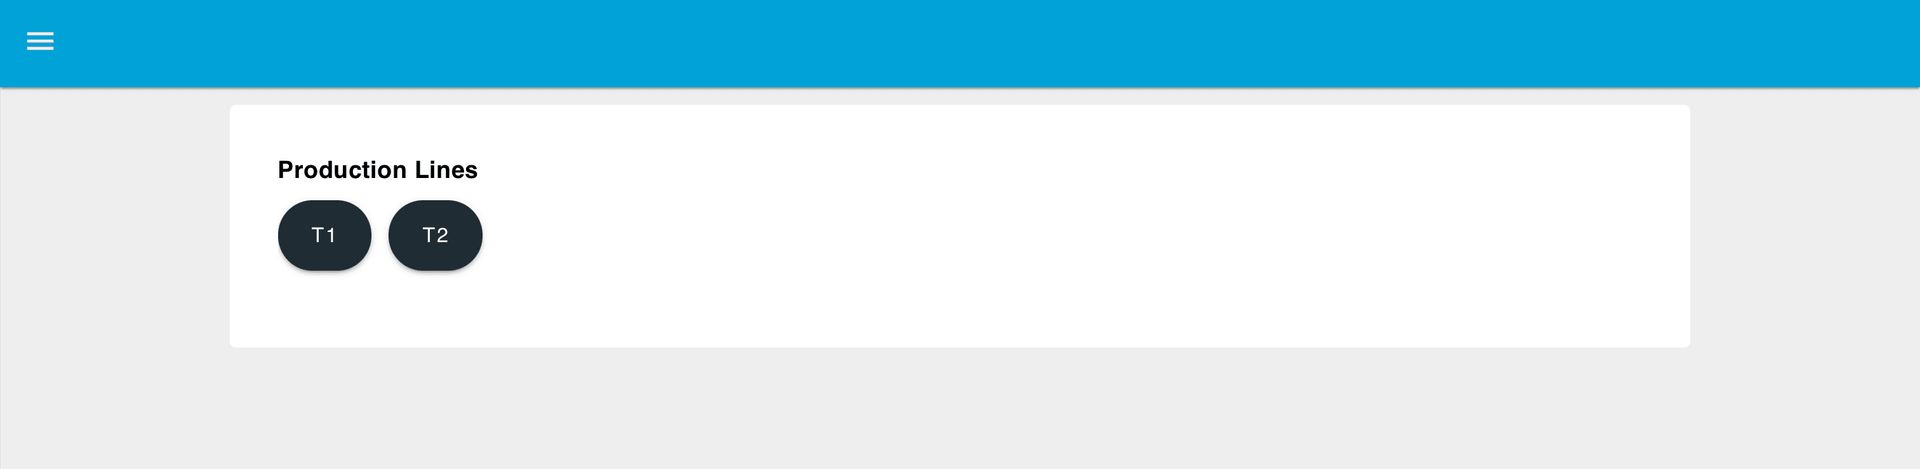
The "line" URL parameter will be used in the next section to store the user's selected production line.
Enable URL-Based Dashboard Access
In this section, we’ll build a flow that allows users to directly access the dashboard using a URL with a line parameter (e.g., ?line=T1). The flow will validate this parameter and store the selected line for each user session. If the parameter is missing or invalid, the user will be redirected to a Not Found page.
To achieve this, we need to:
- Configure the dashboard to expose client-specific metadata.
- Create a flow that validates the line parameter from the URL.
- Store the user’s selected line using session-aware context data.
Configuring Dashboard Widgets to Include Client Information
To ensure client data is available in your flows, follow these steps:
- Open the Dashboard 2.0 sidebar.
- Switch to the Client Data tab.
- Enable the option “Include client data”.
- Tick the checkbox in front of:
- ui-control
- ui-template
- ui-button
- ui-text-input
- ui-dropdown
- ui-notification
- Deploy the updated configuration.
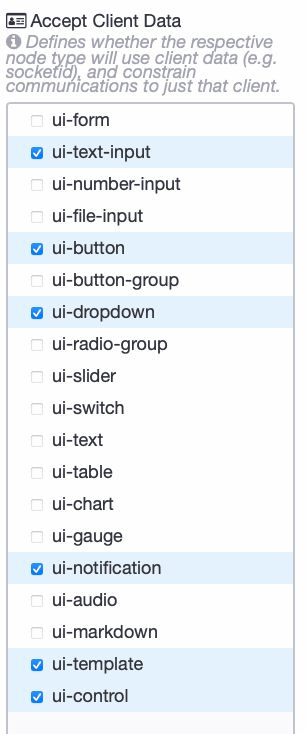
With this setting enabled, the selected widgets will include client-related metadata in their output messages under the msg._client property. This metadata is essential for building session-aware features in the Dashboard.
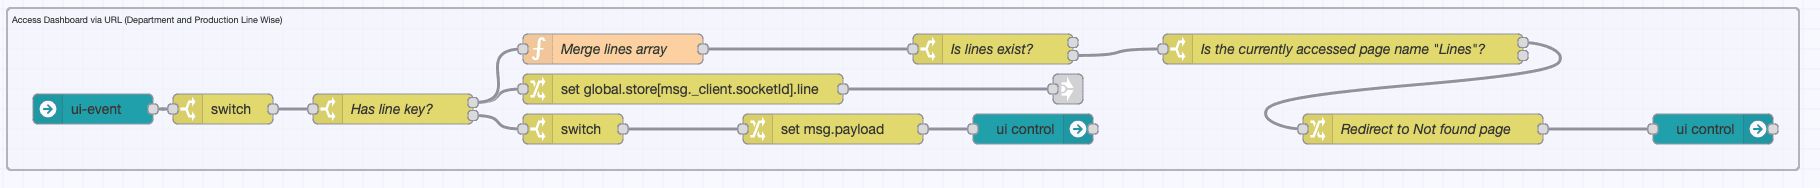
Building a Dashboard Flow for URL Access, Line Validation, and User Selection
In this section, we'll build a Node-RED flow that handles dashboard access via direct URLs, validates the line parameter, and stores the selected line per user session using client metadata. This ensures that each user's line selection is tracked independently and that invalid or missing parameters are handled gracefully.
The flow performs the following key tasks:
- Detects when a user accesses the dashboard using a URL containing a line parameter.
- Validates the parameter against a list of predefined production lines.
- Stores the selected line using session-aware (client-specific) data.
- Redirects the user appropriately based on the validity of the parameter.
Steps to Build the Flow:
-
Drag a ui-event node onto the canvas and configure it with the correct UI base path.
-
Drag a switch node and name it "Is it a pageview event?" and configure it with the property
msg.topicand add the following condition:== $pageview
-
Drag another switch node and name it "Has line key?" and configure it with the property
msg.payload.page.params.line, with two conditions:- has key
line - is empty
- has key
-
Connect the ui-event node to the first switch node (labeled Is it a pageview event?). Then, connect the first output of this switch node to the second switch node (labeled Has line key?). This checks whether the page was accessed via URL and if a line parameter is present.
-
Drag a
functionnode and name it "Extract Labels from Lines" and paste the following code:let lines = global.get('lines', 'persistent') || [];
let labels = [
...lines.map(obj => obj.label),
];
msg.payload.labels = labels;
return msg;
This retrieves the list of available lines from the persistent global context, extracts their labels, and creates an array for easier verification of whether the user selected line is present.
- Drag a change node and name it "Store line selection":
- Set
global.store[msg._client.socketId].linetomsg.payload.
- Set
- Drag another switch node and name it "Is the currently accessed page 'Lines'?":
- is equal to "Lines"
- Connect the function node (Extract Labels from Lines) and the change node (Store line selection) to the first output of the switch node (Has line key?).
- Drag another
switchnode and name it "Is line valid?" and set the property tomsg.payload.labelsand add following conditions:- contains
global.store[msg._client.socketId].line
- contains
- For the first output of the
switchnode (Is the currently accessed page 'Lines'?), drag a change node and name it "Redirect the user to the All Lines menu" and Configure it to:- Set
msg.payloadto"All Lines"
- Set
- Drag a ui-control node onto the canvas and connect it to the change node (Redirect the user to the All Lines menu). This node will handle the redirection or display feedback on the dashboard.
This checks whether the selected line is valid by comparing it with the list of known line labels.
- For the second output of the switch node (Is line valid?), drag a switch node and give it name "Is the currently accessed page 'Lines'?" and Set property to
msg.payload.page.nameand add following condition to check against:
- == "Lines"
- Otherwise
- For the first output of the switch node ((Is the currently accessed page 'Lines'?), drag a change node and configure it to: - Set
msg.payloadto "Incorrect Link" - Drag a ui-control node onto the canvas and configure it with the correct UI base path and connect it the change node (Redirect to Not found page).
- Deploy the changes.
Create Live Request Flow (Per Line)
Let’s build the flow to retrieve the data now based on the user selection.
-
Drag a
Templatewidget onto the canvas. -
Double-click the Template widget to open its configuration.
-
Set the scope to
uiand select the appropriate UI Base. -
Paste the following script into the content field. This script triggers every second and sends a message that includes the current user's client data:
<script>
  export default {
    mounted() {
      // Set an interval to update the message every second
      this.intervalId = setInterval(() => {
        this.send('Component has loaded');
      }, 1000);
    },
    beforeUnmount() {
      // Clear the interval when the component is about to be destroyed
      clearInterval(this.intervalId);
    },
  };
</script> -
Drag a
Changenode and name it "Set params". -
Configure the Change node with the following rules:
- Set
msg.params.$linetoglobal.store[msg._client.socketId].line - Set
msg.queryto"line"
- Set
-
Drag a
Templatenode onto the canvas. -
Double-click the Template node and set the property to
msg.topic. -
Paste the following SQL query into the content field:
SELECT * FROM requests WHERE "" = "" AND resolved IS NULL -
Drag a
Markdownwidget and name it "Show currently selected line". -
Create a new group in the UI for the Markdown widget to render into.
-
Enter the following content into the Markdown widget:
<h1 style="text-align: center;">Line: </h1>
- Drag a
SQLitenode onto the canvas. - Select the appropriate database configuration.
- Set the node to use the SQL query via "Prepared Statement".
- Connect the
Templatewidget toChangenode andTemplatenode toSQLitenode. - Drag a
link-outnode onto the canvas and connect it to theSQLitenode. - Deploy the changes.
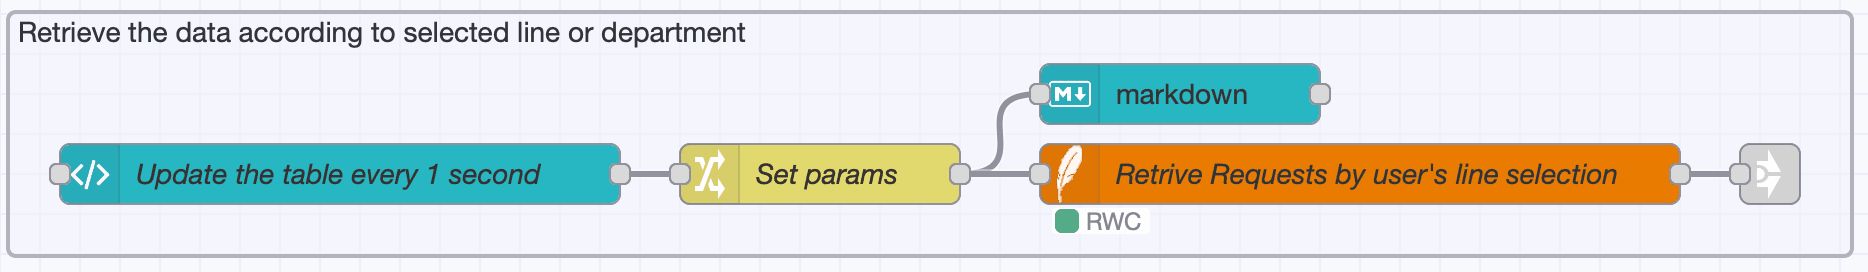
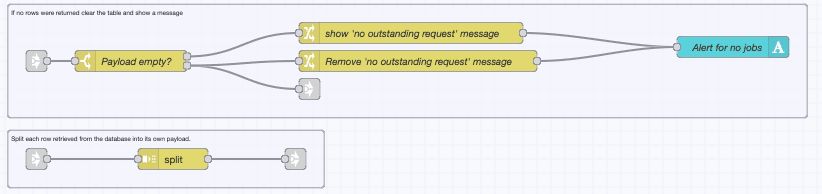
Preparing Data Rendering it in a Table
Once the data is retrieved, it needs to be validated, formatted, and routed appropriately for display. In this section, a flow will be built to check whether any unresolved requests exist for the selected production line. If there are no requests, a message will be shown to the user. Otherwise, the data will be processed and rendered in a table format using Dashboard widgets.
-
Drag a link-in node onto the canvas and connect it to the last link-out node.
-
Add a switch node to check whether the
msg.payloadis empty, name it "Is Payload empty?".- Configure the switch with the following conditions:
msg.payload is emptyOtherwise
- Configure the switch with the following conditions:
-
Drag a change node, name it "Show 'no outstanding request' message" and configure it to set a message when the payload is empty:
- Set
msg.payloadto"There are no outstanding requests"
- Set
-
Connect this change node to the first output of the switch node ("Is Payload empty?").
-
Drag another change node, name it "Remove 'no outstanding request' message" and configure it as follows:
- Set
msg.payloadto an empty string""
- Set
-
Connect this second change node to the second output of the switch node ("Is Payload empty?").
-
Drag a text widget, name it "Text Widget for Message", onto the canvas, double-click it, and add a new group in the "Lines" page to render the message.
-
Connect the text widget ("Text Widget for Message") to both change nodes that are setting the text message ("Show 'no outstanding request' message" and "Remove 'no outstanding request' message").
-
Drag another link-out node onto the canvas and connect it to the second output of the switch node ("Is Payload empty?") that checks whether
msg.payloadis empty. -
Drag another link-in onto the canvas.
-
Drag a split node, name it "Split Node", onto the canvas and connect it to the link-in node.
-
Drag a link-out node and connect it to the split node.
-
Deploy the changes.
Setting Up Visual Alerts and Timestamp Formatting
To enhance the visibility of production line requests, this section focuses on setting up visual alerts based on the age of each request and formatting timestamps in a user-friendly way. The created timestamp is always shown using relative time (e.g., "5 minutes ago"). For acknowledged and resolved, relative formatting is applied only when those timestamps are available. This improves readability and makes it easier to identify requests that are pending action.
-
Drag a link-in node and a function node onto the canvas. Name the function node as "Highlight Old Requests" and open it.
-
Paste the following JavaScript code into the function node:
const requested = msg.payload.requested;
const now = Date.now();

const requestedTime = new Date(requested).getTime();
const difference = now - requestedTime;

const oldRequestThreshold = global.get('oldRequestThreshold');
const veryOldRequestThreshold = global.get('veryOldRequestThreshold');
const alertActivationThreshold = global.get('alertActivationThreshold');

if (difference > (veryOldRequestThreshold * 60 * 1000)) {
   msg.payload.class = 'older';
   if (difference > (alertActivationThreshold * 60 * 1000)) {
       msg.payload.alert = true;
   }
   return msg;
}
else if (difference > (oldRequestThreshold * 60 * 1000)) {
   msg.payload.class = 'old';
   if (difference > (alertActivationThreshold * 60 * 1000)) {
       msg.payload.alert = true;
   }
   return msg;
}
else {
   if (difference > (alertActivationThreshold * 60 * 1000)) {
       msg.payload.alert = true;
   }
   msg.payload.class = 'normal';
   return msg;
}- Connect the link-in node to the function node.
- Drag a date time formatter node onto the canvas. Name it "Format Requested Time" and double-click it to configure.
- Set outputFrom to fromNow.
- Set both input and output to
msg.payload.requested.
- Connect the function node to the date time formatter node.
- Drag a link-out node and connect it to the function node.
- Drag a switch node onto the canvas. Name it "Check if Acknowledged is null". Set the property to
msg.payload.acknowledged, and add the following conditions:- is null
- Otherwise
- Connect the function node to the switch node.
- Drag a second date time formatter node onto the canvas. Name it "Format Acknowledged Time".
- Set outputFrom to fromNow.
- Set both input and output to
msg.payload.acknowledged.
- Connect the second date time formatter node to the second output of the switch node ("Check if Acknowledged is null").
- Drag another switch node onto the canvas. Name it "Check if Resolved is null". set the property to
msg.payload.resolved. Add the following conditions:
- is null
- Otherwise
- Connect this switch node ("Check if Resolved is null") to the output of the second date time formatter ("Format Acknowledged Time") node and to the first output of the first switch node ("Check if Acknowledged is null").
- Drag a third date time formatter node onto the canvas. Name it "Format Resolved Time" and set outputFrom to fromNow. Set both input and output to
msg.payload.resolved. - Connect this third date time formatter node to the second output of the second switch node ("Check if Resolved is null") .
- Drag a link-out node and connect it to the third date time formatter node.
- Drag another link-out node and connect it to the first output of the second switch node. Name it "Link to First Switch Output".
- Deploy the changes.


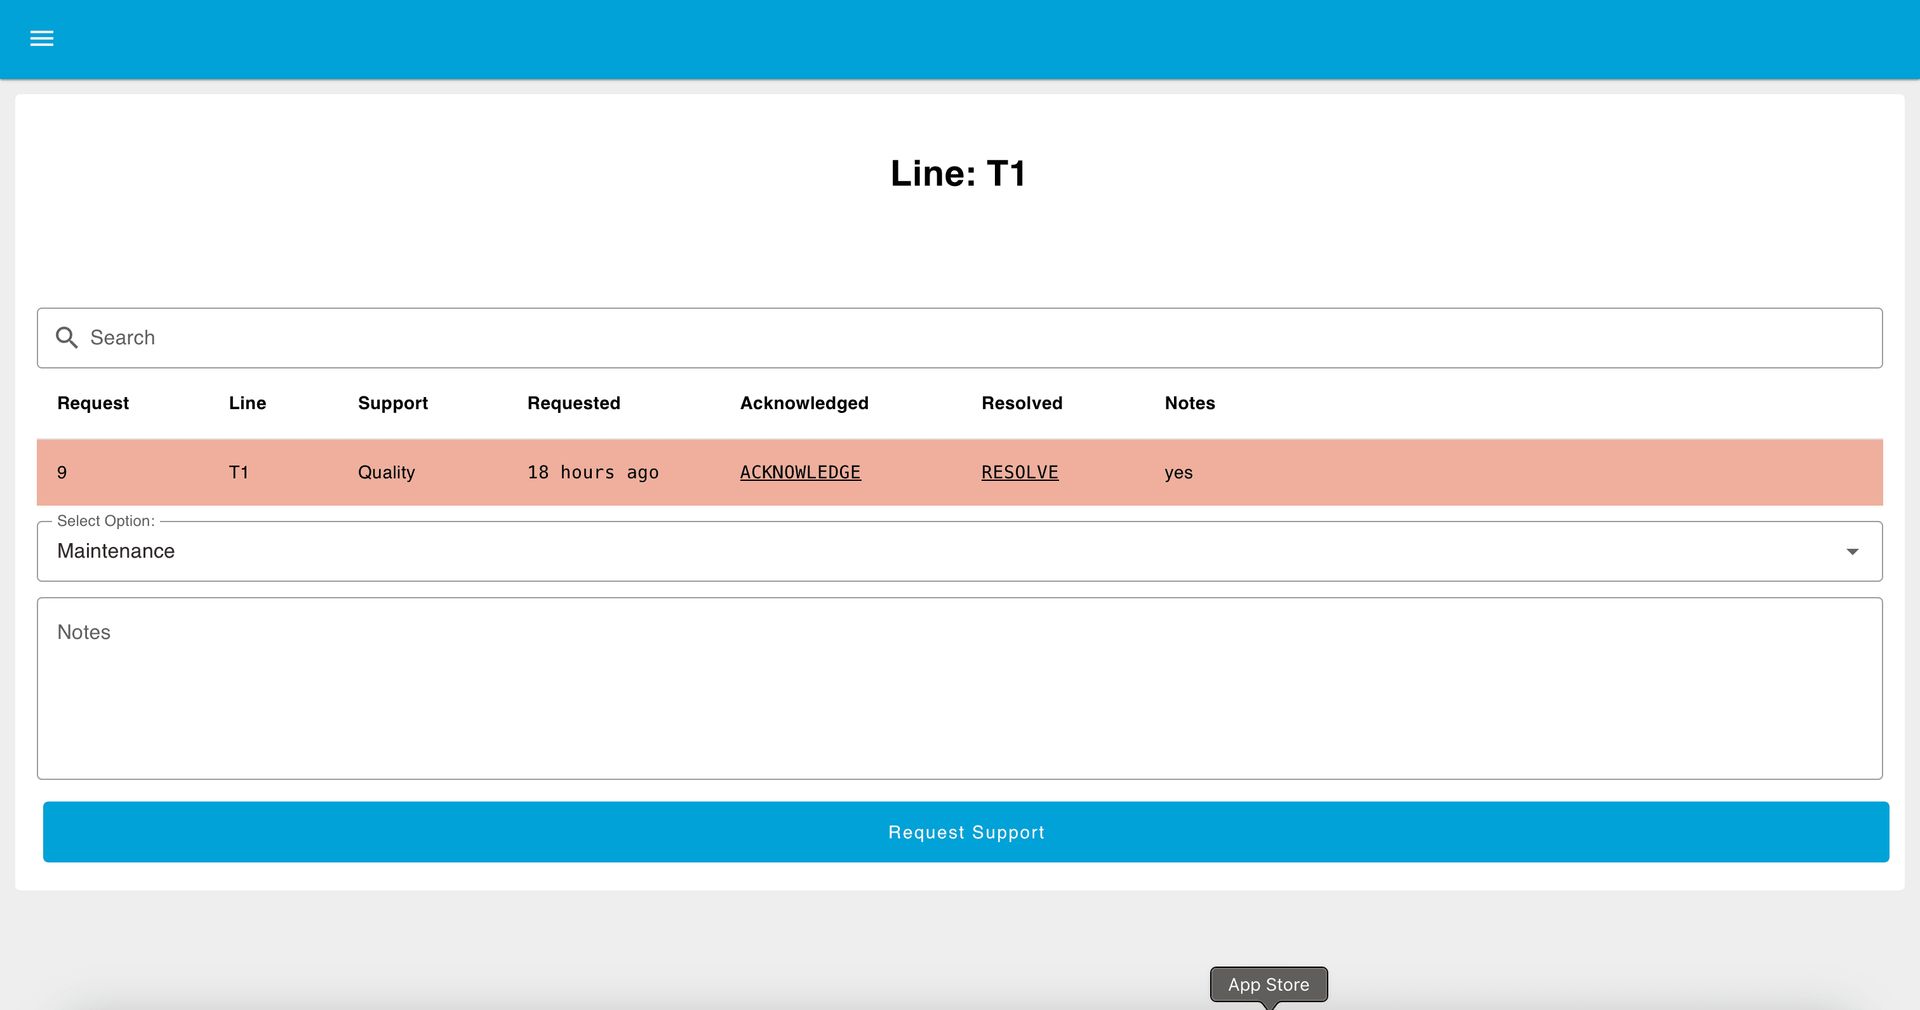
Highlight Requests with CSS & Add Buttons to Update Request Status
We have the data prepared, the class property added to each request message, and the timestamp formatted for better readability. In this section, we will add 'Resolve' and 'Acknowledge' buttons for each request to update its status and apply CSS classes based on the status property for visual highlighting.
-
Drag a link-in node onto the canvas and connect it to the last link-out node.
-
Drag a switch node, name it "Is acknowledged null?", and set the property to
msg.payload.acknowledged. Add the following conditions:- is null
- otherwise
-
Drag a template node, name it "Build ack link", set the property to
msg.payload.acknowledged, and add the following Mustache:<a href="/dashboard/lines?line=&action=ack&request=" style="color: #000000" class="">ACKNOWLEDGE</a> -
Connect the link-in node to the switch node. Connect the first output of the switch node ("Is acknowledged null?") to the input of the template node.
-
Drag another switch node, name it "Is resolved null?", set the property to
msg.payload.resolved, and add the following conditions:- is null
- otherwise
-
Drag a template node, give it name "Build res link", set the property to
msg.payload.resolved, and add the following Mustache:<a href="/dashboard/lines?line=&action=res&request=" style="color: #000000">RESOLVE</a> -
Connect the input of this second switch node ("Is resolved null?") to the second output of the previous switch node (
acknowledgedswitch), then connect the first output of theresolvedswitch node to the input of the second template node. -
Drag a link-out node and connect both outputs of the
resolvedswitch node to this link-out. -
Deploy the changes.

Adding a Mechanism to Update the Status of a Request in the Database
-
Drag ui event widget onto the canvas and configure it with the correct ui base.
-
Drag change node onto the canvas and add the following element:
- Set
msg.paramsto{} - Set
msg.params.$requesttomsg.payload.query.request
- Set
-
Drag Date/Time Formatter node onto the canvas and set input format to "timestamp: milliseconds since epoch" and output to
msg.now. -
Drag switch node onto the canvas, set property to
msg.query.action, and add the following conditions to check against:- == ack
- == res
- otherwise
-
Drag two SQLite nodes onto the canvas, select the correct database configuration for both, and set the query type to 'Prepared Statement'.
-
For the first, set the following sql query:
UPDATE requests
SET acknowledged = $now
WHERE rowid = $request
AND acknowledged IS NULL -
For the second, set the following sql query:
UPDATE requests
SET resolved = $now
WHERE rowid = $request
AND resolved IS NULL -
Connect the ui event widget to change node, change node to date/time formatter node, date/time formatter to switch node, and:
- switch node first output to first first sqlite node
- switch node second output to second second sqlite node
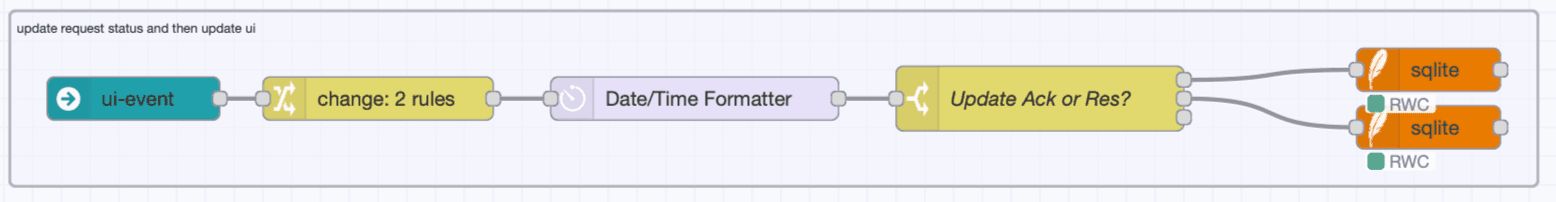
Flow that handles the update of request status based on user actions (Acknowledged or Resolved).
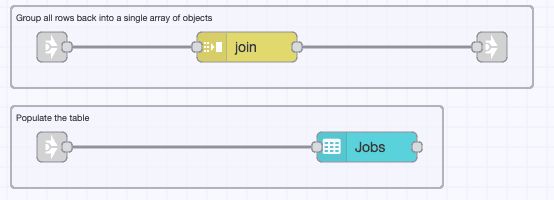
Render Request Data in a Table
Now, let's display the prepared data in a table. To do this, we'll use a ui_table widget. However, before displaying, we need to convert the data back into an array, as we are currently spilling array data retrieved from the database into a single message.
-
Drag a link-in node onto the canvas and connect it to the last link-out node.
-
Drag a join node onto the canvas and connect it to the link-in node. Double-click on the join node and set the mode to automatic.
-
Drag another link-out node and connect it to the join node.
-
Drag a link-in node and connect it to the last link-out node.
-
Drag a ui_table widget onto the canvas and double-click to configure.
-
Create a new group on the lines page.
-
Set Action to
replaceand Interaction tonone. -
Untick the Auto Calculate Columns option.
-
Add the following column elements:
- Key: rowid, Label: Request, Align: Left, Type: Text
- Key: line, Label: Line, Align: Left, Type: Text
- Key: support, Label: Support, Align: Left, Type: Text
- Key: requested, Label: Requested, Align: Left, Type: HTML
- Key: acknowledged, Label: Acknowledged, Align: Left, Type: HTML
- Key: resolved, Label: Resolved, Align: Left, Type: HTML
- Key: notes, Label: Notes, Align: Left, Type: Text
-
Deploy the changes.
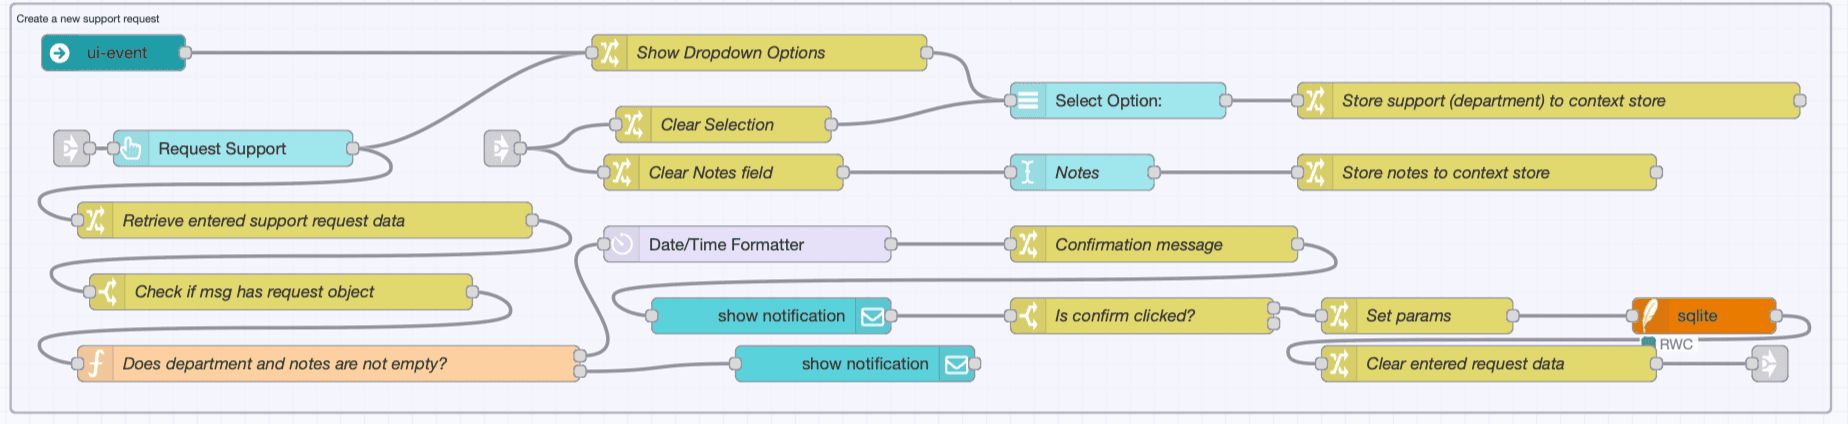
Create New Request Submission Flow
To create a flow that allows users to submit a request, follow these steps to set up the necessary UI elements, store the request details, validate input, and store the data in a database.
-
Drag the ui-event widget onto the canvas and configure it with the correct UI settings.
-
Drag a change node to retrieve the department list and name it "Show Dropdown Options". Add the following:
- Set
msg.ui_update.optionstoglobal.departments.
- Set
-
Create a new group for the dropdown widget on the lines page. Connect the change node to the input of the dropdown widget, then link it to the ui-event node.
-
Drag another change node and set
msg.payloadtomsg.store[msg._client.socketId].support. Name it "Store support (department) to context store". -
Drag a text input widget for the notes field. Create a group for it in the lines page.
-
Add another change node to store the notes in the global context and name it "Store notes to context store":
- Set
msg.payloadtomsg.store[msg._client.socketId].notes.
- Set
-
Connect the change node ("Store support (department) to context store") to the input of the dropdown widget and connect the change node ("Store notes to context store") to the text input widget.
-
Drag the button widget, label it "Request Support," and connect it to the change node that updates the UI with the department list.
-
Add a change node to store the request details in the global context and name it "Retrieve entered support request data":
- Set
msg.requestto{}. - Set
msg.request.supportto the valuemsg.store[msg._client.socketId].support. - Set
msg.request.notesto the valuemsg.store[msg._client.socketId].notes. - Set
msg.request.lineto the valuemsg.store[msg._client.socketId].line. - Set
msg.request.referenceto the valuemsg.store[msg._client.socketId].reference.
- Set
-
Drag the switch node onto the canvas and set property to
msg.requestand add condtion to check "is not null". -
Drag a function node and add the following code. Name it "Does department and notes are not empty?":
let request = msg.request;
if (typeof request !== "object" || request === null) {
   msg.payload = "Request must be an object.";
   return [null, null, msg];
} else if (!request.hasOwnProperty("support")) {
   msg.payload = "Please select the appropriate department for the request.";
   return [null, msg, null];
} else if (!request.hasOwnProperty("notes") || typeof request.notes !== "string" || request.notes.trim() === "") {
   msg.payload = "Please add notes to provide more context on the request.";
   return [null, null, msg];
} else {
   return [msg, null, null];
}-
Connect the change node to switch node and switch node to function node. Connect the function node's first output to a Date/Time Formatter node. Set the input to 'Timestamp (milliseconds since epoch)' and the output to
msg.request.time. -
Drag a change node and set
msg.payloadto "Are you sure you want to submit a request?". Name it "Set Confirmation message". -
Connect the change node ("Set Confirmation message") to the Date/Time Formatter node.
-
Drag a ui-notification widget, configure it with the correct UI, and set the position to center, checked the checkbox for both allow mnaual dismisal and all amnual confirmation, change close to "Cancel".
-
Connect the change node ("Set Confirmation message") to the ui-notification widget.
-
Drag another ui-notification widget, configure it with the correct UI, and set the position to center.
-
connect it to the second output of the function node.
-
Add a switch node and set the property to
msg.payloadwith the condition:
- ==
confirm_clickedName it "Is confirm clicked?"
- Drag a change node and add the following elements and give it name "Set Params":
- Set
msg.paramsto{}. - Set
msg.params.$lineto the valuemsg.request.linet. - Set
msg.params.$supportto the valuemsg.request.support. - Set
msg.params.$timeto the valuemsg.request.time. - Set
msg.params.$notesto the valuemsg.request.notes.
-
Connect the change node ("Set Params") to the switch node ("Is confirm clicked?").
-
Drag a sqlite node, select the correct database configuration, and choose SQL Query via "Prepared Statement" and connect that sqlite node to the input change node ("Set Params")
-
Drag a change node and set the following, give it name "Clear entered request data":
- Delete
msg.store[msg._client.socketId].support. - Delete
msg.store[msg._client.socketId].notes.
-
Connect the change node* ("Clear entered request data") to the sqlite node.
-
Drag a link-out node and connect it to the last change node.
-
Drag a link-in node and connect it to the last link-out node.
-
Drag two change nodes and configure them as follows:
- First change node: Set
msg.payloadto an empty array[]. - Second change node: Set
msg.payloadto an empty string"".
-
Connect the change nodes to the link-in node to complete the flow.
-
Connect the first change node to the ui dropdown widget and the second to the text input widget.
-
Deploy the changes.
We have now successfully built one part of the Andon task dashboard. You can open the line view in the dashboard and check whether you can submit a request, mark it as acknowledged, and resolve it.
Up Next
Up until now, the focus has been on building the core functionality of the Andon Task Manager dashboard, including the Lines page. Design and layout have not been the priority. In the next part, you will learn how to enhance the visual design, improve usability, and create a dedicated page and menu for departments.
Later, we will guide you through building the Admin page for the Andon Task Manager dashboard—enabling request management, department configuration, and overall system control.
Discuss your use case with our team
See how FlowFuse can support your architecture, integrations, and deployment needs.
About the Author
Sumit Shinde
Technical Writer
Sumit is a Technical Writer at FlowFuse who helps engineers adopt Node-RED for industrial automation projects. He has authored over 100 articles covering industrial protocols (OPC UA, MQTT, Modbus), Unified Namespace architectures, and practical manufacturing solutions. Through his writing, he makes complex industrial concepts accessible, helping teams connect legacy equipment, build real-time dashboards, and implement Industry 4.0 strategies.
Table of Contents
- Getting Started
- Highlight Requests with CSS & Add Buttons to Update Request Status
- Create New Request Submission Flow
- Up Next