Exploring Node-RED Dashboard 2.0 Widgets
A guide to using Node-RED 2.0 Widgets for Dashboard Development.
This guide delves into Node-RED Dashboard 2.0 widgets. It is a guide on how to build a Dashboard application, and will cover many of the widgets available today.
If you're new to Dashboard 2.0, we recommend starting with the Getting Started with Dashboard 2.0 guide and make sure to install it.
What Are Widgets?
Widgets in Node-RED Dashboard 2.0 are the building blocks for creating a user interface. In Dashboard 2.0, you get a variety of widgets like forms, templates, buttons, and others to make different parts of your interface.
Building Applications with Dashboard 2.0 Widgets
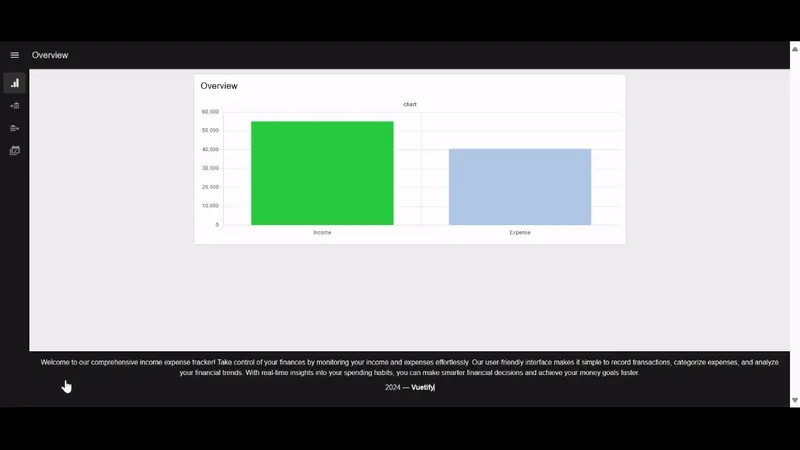
In this guide, we'll create a basic application to input expenses and income. This will then be displayed in a chart and table for analysis. The application will utilize a wide range of widgets available in Dashboard 2.0, helping you understand and use them confidently.
Adding Forms
For the income and expense submission, we'll incorporate a form using the ui-form widget.
- Drag the ui-form widget onto the canvas.
- Double-click on it to access various widget properties and select the ui-group where it should render.
- Add "date", "description", "amount", and "note" form elements by clicking the +element button at the bottom left.
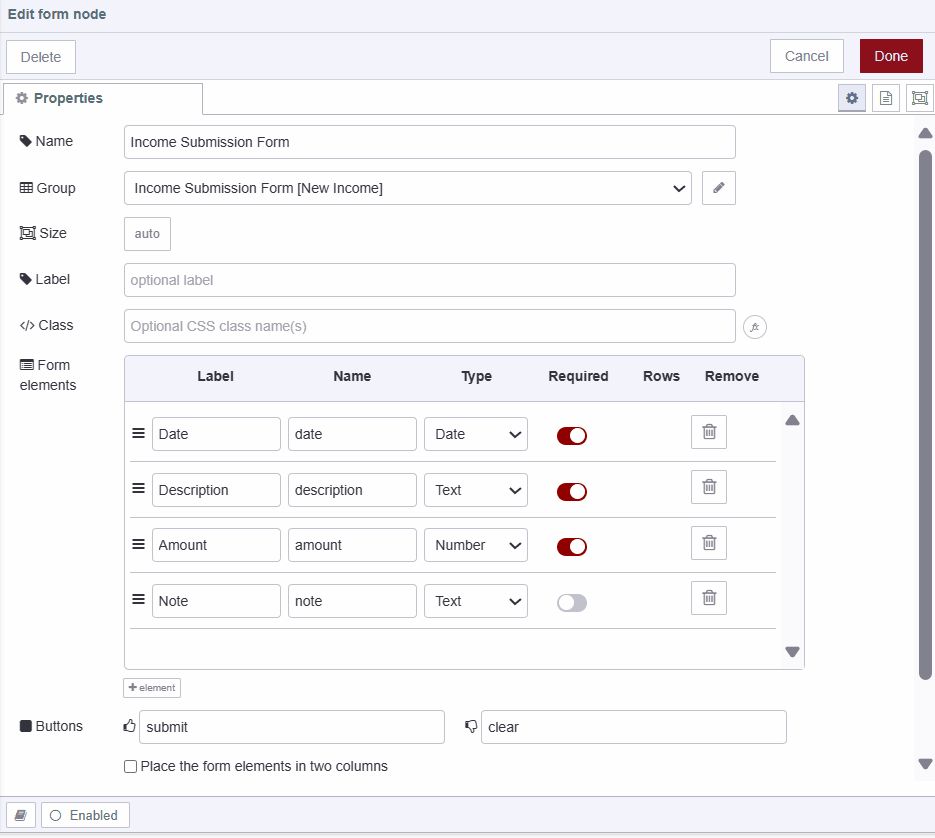
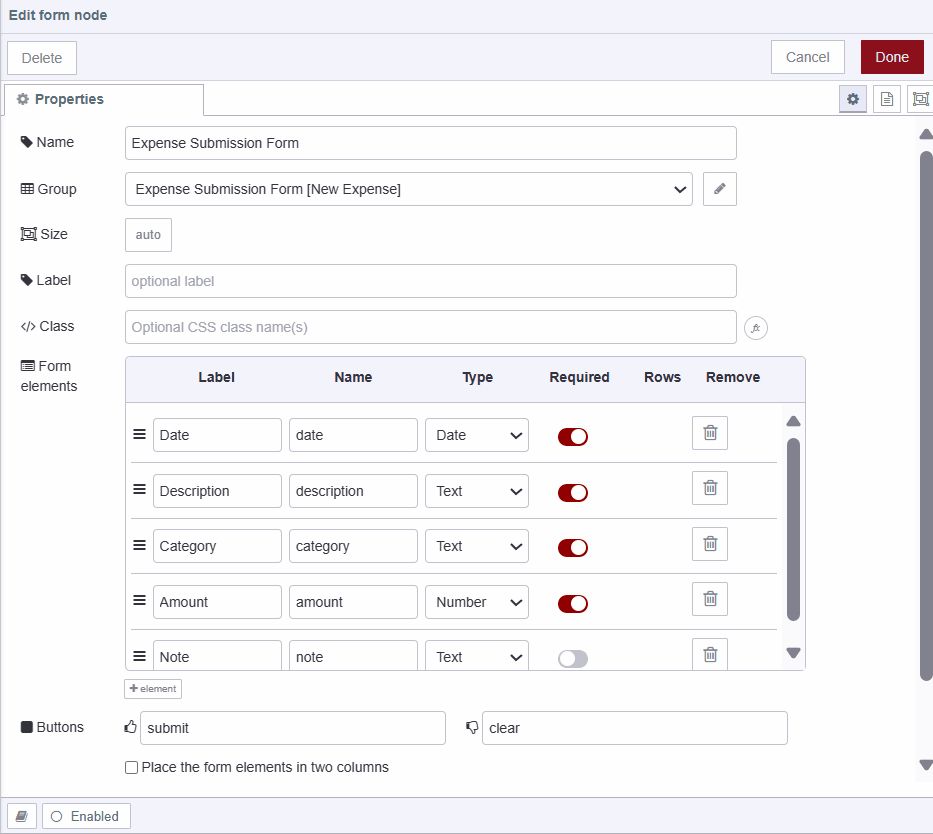
Once you've added the income submission form, repeat the process to add an expense submission form on another ui-page and ui-group. For more information on ui-form, refer to the ui-form docs.
Storing Form Data
The ui-form widget emits a payload object with key-value pairs of form elements upon submission. We'll store this data in a global context, If you are not familiar with Node-RED context, refer to Understanding Node-RED varriables.
- Drag a function node onto the canvas and add the following code. This will store the submission in the
incomeglobal context variable, and then modifymsg.payloadto pass on a notification to any further connected nodes.
// Retrieve the existing 'income' array from the global context, or initialize it as an empty array if it doesn't exist
let income = global.get('income') || [];

// Push the incoming payload along with a 'type' property set to "income" into the 'income' array
income.push({
  ...msg.payload,
  type: "income",
});

// Store the updated 'income' array back into the global context
global.set('income', income);

// Set the message payload to a confirmation message for notification
msg.payload = "Thank you for submitting income!";

// Return the modified message
return msg;
Similarly, you can do this for storing expense data submitted using the expense submission form.
Displaying Notifications
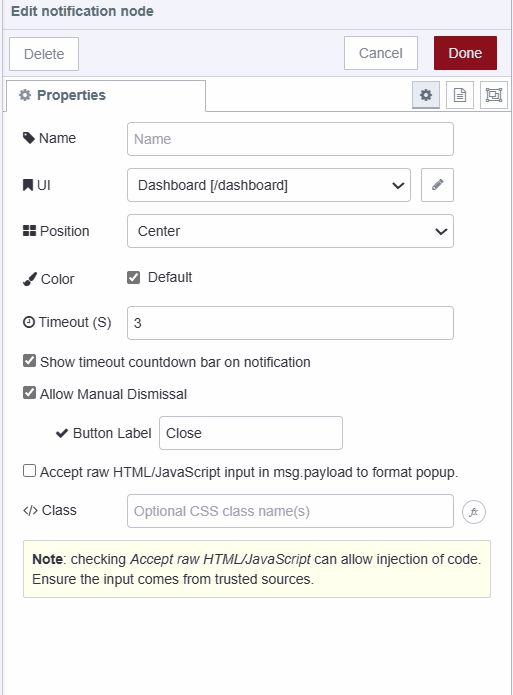
For displaying notifications on the dashboard, we'll utilize the ui-notification widget, which emits notifications to the user's dashboard. It accepts msg.payload which should be a string format or raw HTML/JavaScript for custom formatting.
- Drag the ui-notification widget onto the canvas.
- Set the position property to center. You can also adjust colors or notification timeout by modifying the color and timeout properties. Please take a look at the ui-notification docs for more information on ui-notification.
Listening for events
In Dashboard 2.0, the ui-event widget allows you to listen to user behavior or events. It does not render any content or components on the dashboard. Currently, this widget only listens for page views ($pageview) and leave ($pageleave) events.
With this, we can listen for page view and page leave events and trigger tasks based on those events. For instance, in our application, we will be displaying a table containing income and expense data, along with a chart. We'll update them when navigating to a new page or leaving a page.
- Drag an ui-event widget onto the canvas.
- Double-click on it and select the correct ui-base of your application.
For more information on ui-event refer to ui-event docs.
Retrieving Income-Expense Data
In our income-expense application, we will display the income and expenses in a single table.
- Drag a change node onto the canvas.
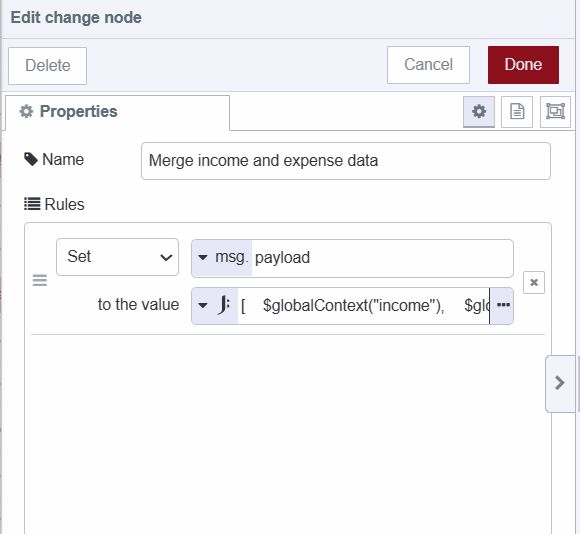
- Set
msg.payloadto the JSONata expression below, which merges the income and expense arrays.
[$globalContext('income'), $globalContext('expense')]- Connect the output of the ui-event widget to the input of the change node.
Displaying Data on the Table
To display data on the table, we use the ui-table widget in Dashboard 2.0. This widget accepts an array of objects as input. The columns in the table correspond to the properties of the objects within the array, and each row represents a different object with values corresponding to those properties.
- Drag a ui-table widget onto the canvas.
- Create a new ui-page and ui-group for it.
- Connect the output of the change node to the input of the ui-table widget.
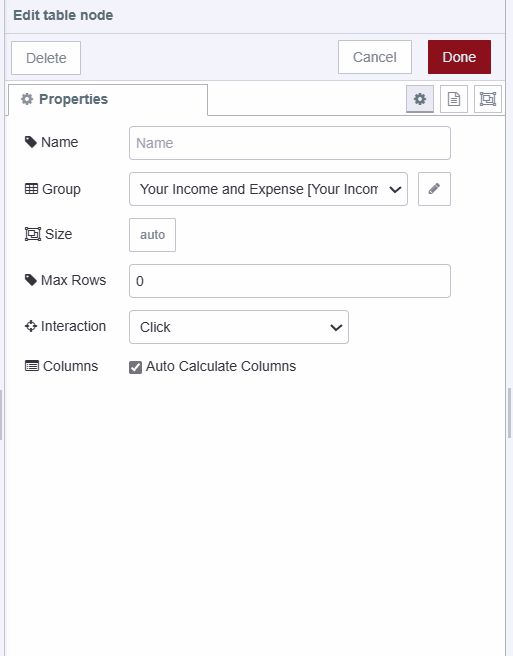
For more information on ui-table refer to ui-table docs
Calculating total category-wise
In our application, we will display data on the chart, showing the total income and total expenses for analysis. In this section, we will calculate the total expenses and income using the function node.
- Drag the two change node onto the canvas.
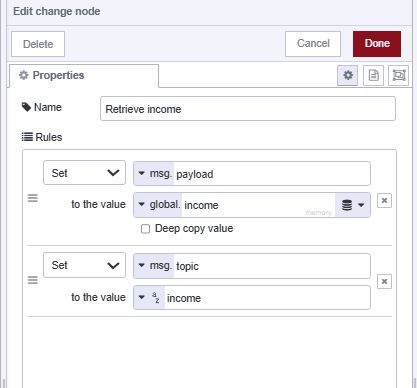
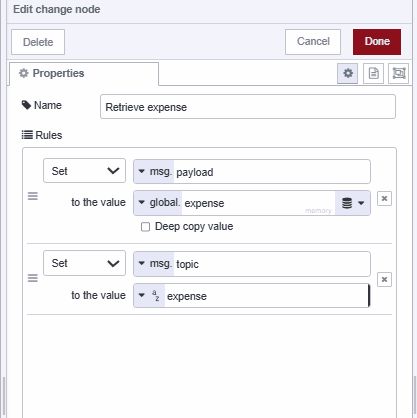
- For the first Change node Set
msg.payloadtoglobal.incomeandmsg.topicto "income" and give it name "retrive income". For the second Change node, setmsg.payloadtoglobal.expenseandmsg.topicto "expense" and give that second change node name "retrive expense".
- Drag a Split node onto the canvas.
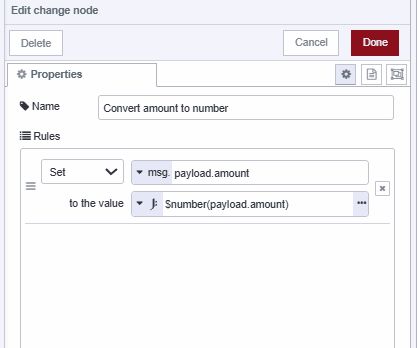
- Drag the Change node onto the canvas and set
msg.payload.amountto the JSONata expression$number(payload.amount)and give it name "Convert amount to number".
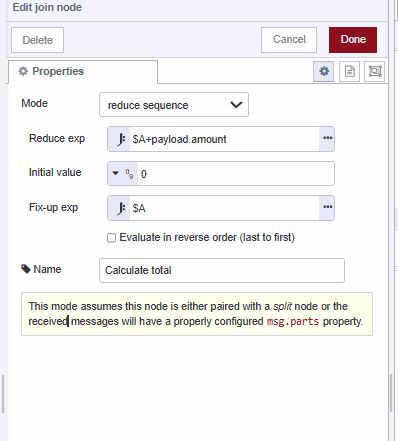
- Drag a Join node onto the canvas, select mode as reduced expression, and set the Reduce exp to
$A + payload.amount. Set Initial value to0, and Fix-up exp to$A. Give this join node the name "Calculate total". This function operates similarly to using the javascript reduce method on an array to calculate the sum of its values.$Astores the accumulated value, and with every incoming message payload, it adds thepayload.amountvalue to it, for more details on this refer to the core node docs on join node.
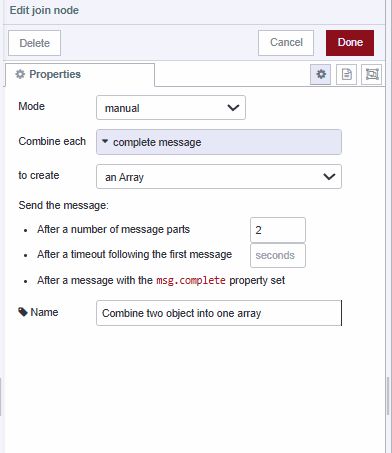
- Drag an another join node onto the canvas set mode to manual, combine each to complete message, to create to array and After a number of message parts to 2 and give it name "combine two objects into array".
-
Connect the output of the ui-event widget to the input of the Change node named "Retrieve Income" and "Retrieve Expense". Then, connect the outputs of the "Retrieve Income" and "Retrieve Expense" Change nodes to the input of the Split node.
-
Next, connect the output of the Split node to the Change node named "Convert Amount to Number". Afterward, connect the output of that Change node to the input of the Join node named "Calculate Total". Finally, connect the output of the "Calculate Total" Join node to the input of the Join node named "Combine Objects into Array".
Displaying data on the chart
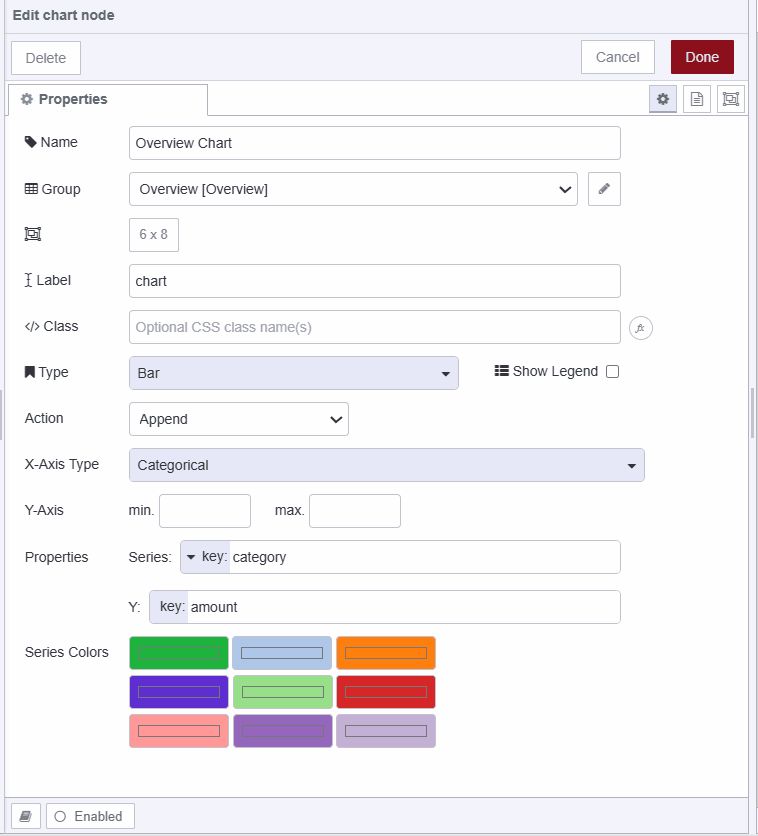
To display charts on the dashboard, we have to use the ui-chart widget which allows us to display different types of charts on a dashboard including linear, bar, scatter, etc. This accepts an array and object as input.
- Drag a ui-chart widget onto the canvas.
- Double-click on the widget and select Type as bar.
- Configure the series to category and the y-axis to amount. This configuration informs the chart that the amount property of the input objects will be plotted on the y-axis and category to the x-axis of the chart.
- Connect the output of the join node named "Combine Objects into Array" to the ui-chart widget's input.
Adding custom footer with ui-template
With the ui-template widget, we can add a custom component to our app using Vue.js. It also allows adding custom CSS for the dashboard and lot of other things. For more information refer to ui-template docs.
Using this widget, we will add a footer to our application.
- Drag an ui-template widget onto the canvas.
- Set the widget type (scoped UI) that will render this widget on the entire dashboard, eliminating the need to add separate footers for each page of the dashboard.
- Insert the following vue.js code in the ui-template widget.
<template>
  <!-- Footer Component -->
  <div class="footer">
    <!-- Description of the Income-Expense Tracker -->
    <div>
      Welcome to our comprehensive income expense tracker! Take control of your finances by monitoring your income and
      expenses effortlessly. Our user-friendly interface makes it simple to record transactions, categorize expenses, and
      analyze your financial trends. With real-time insights into your spending habits, you can make smarter financial
      decisions and achieve your money goals faster.
    </div>
    <!-- Copyright Information -->
    <div class="copyright">
      <!-- Display Current Year and Copyright Information -->
      2024 — <strong>Vuetify</strong>
    </div>
  </div>
</template>
<style scoped>
  /* Make the footer occupy all available space */
  .footer {
    position:absolute;
    bottom:0;
    background-color:rgb(26,26,26);
    color:rgb(238,238,238);
    height:130px;
    text-align:center;
    padding:14px;
  }

  .copyright{
    margin-top:10px;
  }
</style>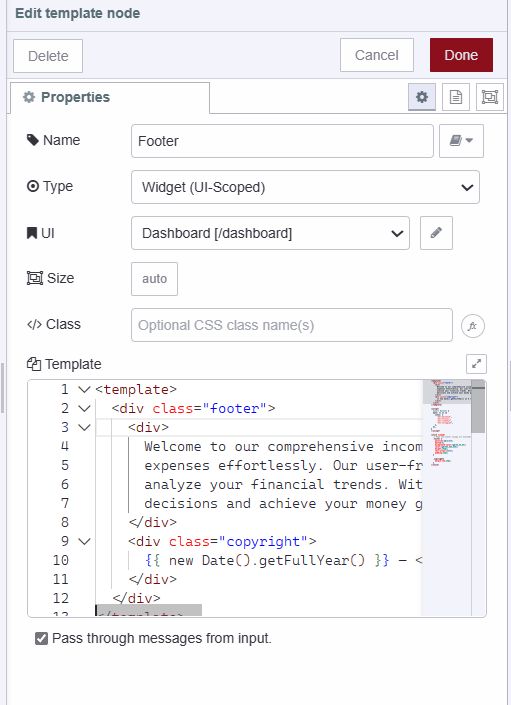
Deploying your application flow
- Deploy the flow by clicking the top right Deploy button.
- Locate the *Open Dashboard button at the top-right corner of the Dashboard 2.0 sidebar and click on it to navigate to the dashboard.
Now that we've built an income-expense tracker application and gained a basic understanding of Dashboard 2.0 widgets for building dashboards.
Up next
If you want to enhance this simple application by adding more features or want to make the application personalize for users, consider the following resources:
-
Webinar - This webinar provides an in-depth discussion of the Personalised Multi-User Dashboards feature and offers guidance on how to get started with it.
-
Comprehensive guide: Node-RED Dashboard 2.0 layout, sidebar, and styling - This comprehensive guide will cover everything about Node-RED Dashboard 2.0 styling, layouts and sidebars.
-
Displaying logged-in users on Dashboard 2.0 - This detailed guide demonstrates how to display logged-in users on Dashboard 2.0 which using the FlowFuse Multiuser addon and FlowFuse.
-
How to Build an Admin Dashboard with Node-RED Dashboard 2.0 - This detailed guide demonstrates how to build a secure admin page in Node-RED Dashboard 2.0.
-
How to Build An Application With Node-RED Dashboard 2.0 - This guide, covers how you can build personalize multiuser dashboard using flow fuse multi-user addon.
-
Multi-User Dashboard for Ticket/Task Management blueprint - this blueprint allows you to utilize templates to develop a personalized multi-user dashboard quickly. This Task management blueprint has all features such as adding, updating, and deleting tasks, user profiles, and admin dashboard.
If you are looking to build a multi-user dashboard, deploy it in seconds, scale and manage Node-RED efficiently, and enable seamless remote access for your entire team, sign up for FlowFuse and get started today!
Looking to build a multi-user dashboard, deploy it in seconds, scale and manage Node-RED efficiently, and enable seamless remote access for your entire team?
Sign Up for FlowFuse Now to Get StartedAbout the Author
Sumit Shinde
Technical Writer
Sumit is a Technical Writer at FlowFuse who helps engineers adopt Node-RED for industrial automation projects. He has authored over 100 articles covering industrial protocols (OPC UA, MQTT, Modbus), Unified Namespace architectures, and practical manufacturing solutions. Through his writing, he makes complex industrial concepts accessible, helping teams connect legacy equipment, build real-time dashboards, and implement Industry 4.0 strategies.
Table of Contents
Related Articles:
- What is 5S Checklist: Definition, Benefits, Implementation, and Template
- Visual Layout Editor - Now Available in Dashboard
- Dialogs, Customizable Icons and Histograms Now Available in FlowFuse Dashboard
- New Layout, Widget and Gauges Now Available in FlowFuse Dashboard
- Customise theming in your FlowFuse Dashboard