node-red-contrib-opentelemetry
Distributed tracing with OpenTelemetry SDK and Prometheus metrics exporter for Node-RED
Node-RED OpenTelemetry





Distributed tracing with OpenTelemetry SDK and Prometheus metrics exporter for Node-RED
Key features
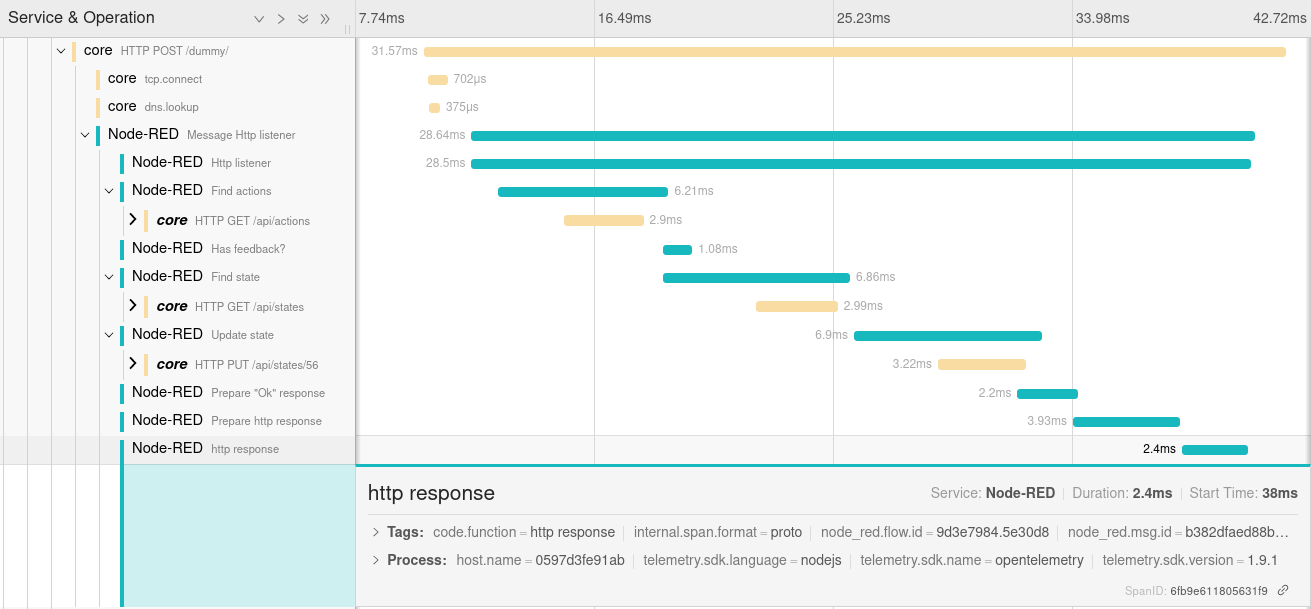
Traces
- based on OpenTelemetry JavaScript framework and Node-RED messaging hooks:
- create spans on
onSend(source)andpostDeliver(destination)events, - end spans on
onCompleteandpostDeliver(source)events.
- create spans on
- one trace per flow execution: every node reached by a message is a child span of a trace, regardless of any changes made to the message's identifier (see What is a local root span?),
- completes the caller trace when the entry node receives a W3C trace context (
http inheaders,mqtt inv5 user properties,amqp-inheaders), - trace includes:
- run id (internal identifier, based on msg._id and an incremental sequence),
- type of the node that triggered the message (
node_red.trigger.type, on the local root span), - message id,
- flow id,
- node id,
- node type,
- node name (if filled),
- hostname,
- optional
http status code(for request node type), - optional
exception, - optional custom attributes based on message data.
What is a local root span?
A trace corresponds to an execution of your flow. The first node to emit a message opens a local root span, each node reached by the message becomes a child span, and the local root span ends when the last of those node spans ends. The local root span carries node_red.trigger.type, which is the type of the node that triggered the execution. This allows a collector to route or filter it without having to read the spans of the individual nodes.
The local root span corresponds to the root of the trace, unless a trace context has been passed with the message, in which case it is a child span of the caller's span.
By default, every node span is a child of it, resulting in a flat timeline that is easy to read and allows you to see at a glance where time has elapsed. Check the Nest spans box in the OTEL node configuration so that a node span becomes a child of the span of the node that sent it the message. This allows you to trace the path taken by a message or build a dependency graph, at the cost of a deeper waterfall. A chain with more than 50 levels restarts from the local root span.
Node-RED assigns a fresh _msgid to each message object emitted by a node. To keep those in the same trace, the run identifier is carried in the message's new otelRootMsgId property (known internally as runId).
Two situations deliberately produce more than one trace, following the messaging semantic conventions:
- a node that acknowledges receipt of a message and emits later (
delay,trigger, rate limiter) creates a new trace, connected to the one from which it originated by a span link (node_red.link.type: continuation), - a message published to a broker and consumed by another flow creates a new trace, correlated through the propagated trace context.
Nodes that never report completion (tcp in, server-events, ...) have their spans closed as soon as the message they created has been dispatched. A trace that remains incomplete beyond the configured timeout is closed by a cleanup, and the spans of nodes that are still open are ended and flagged with node_red.span.incomplete instead of being dropped.
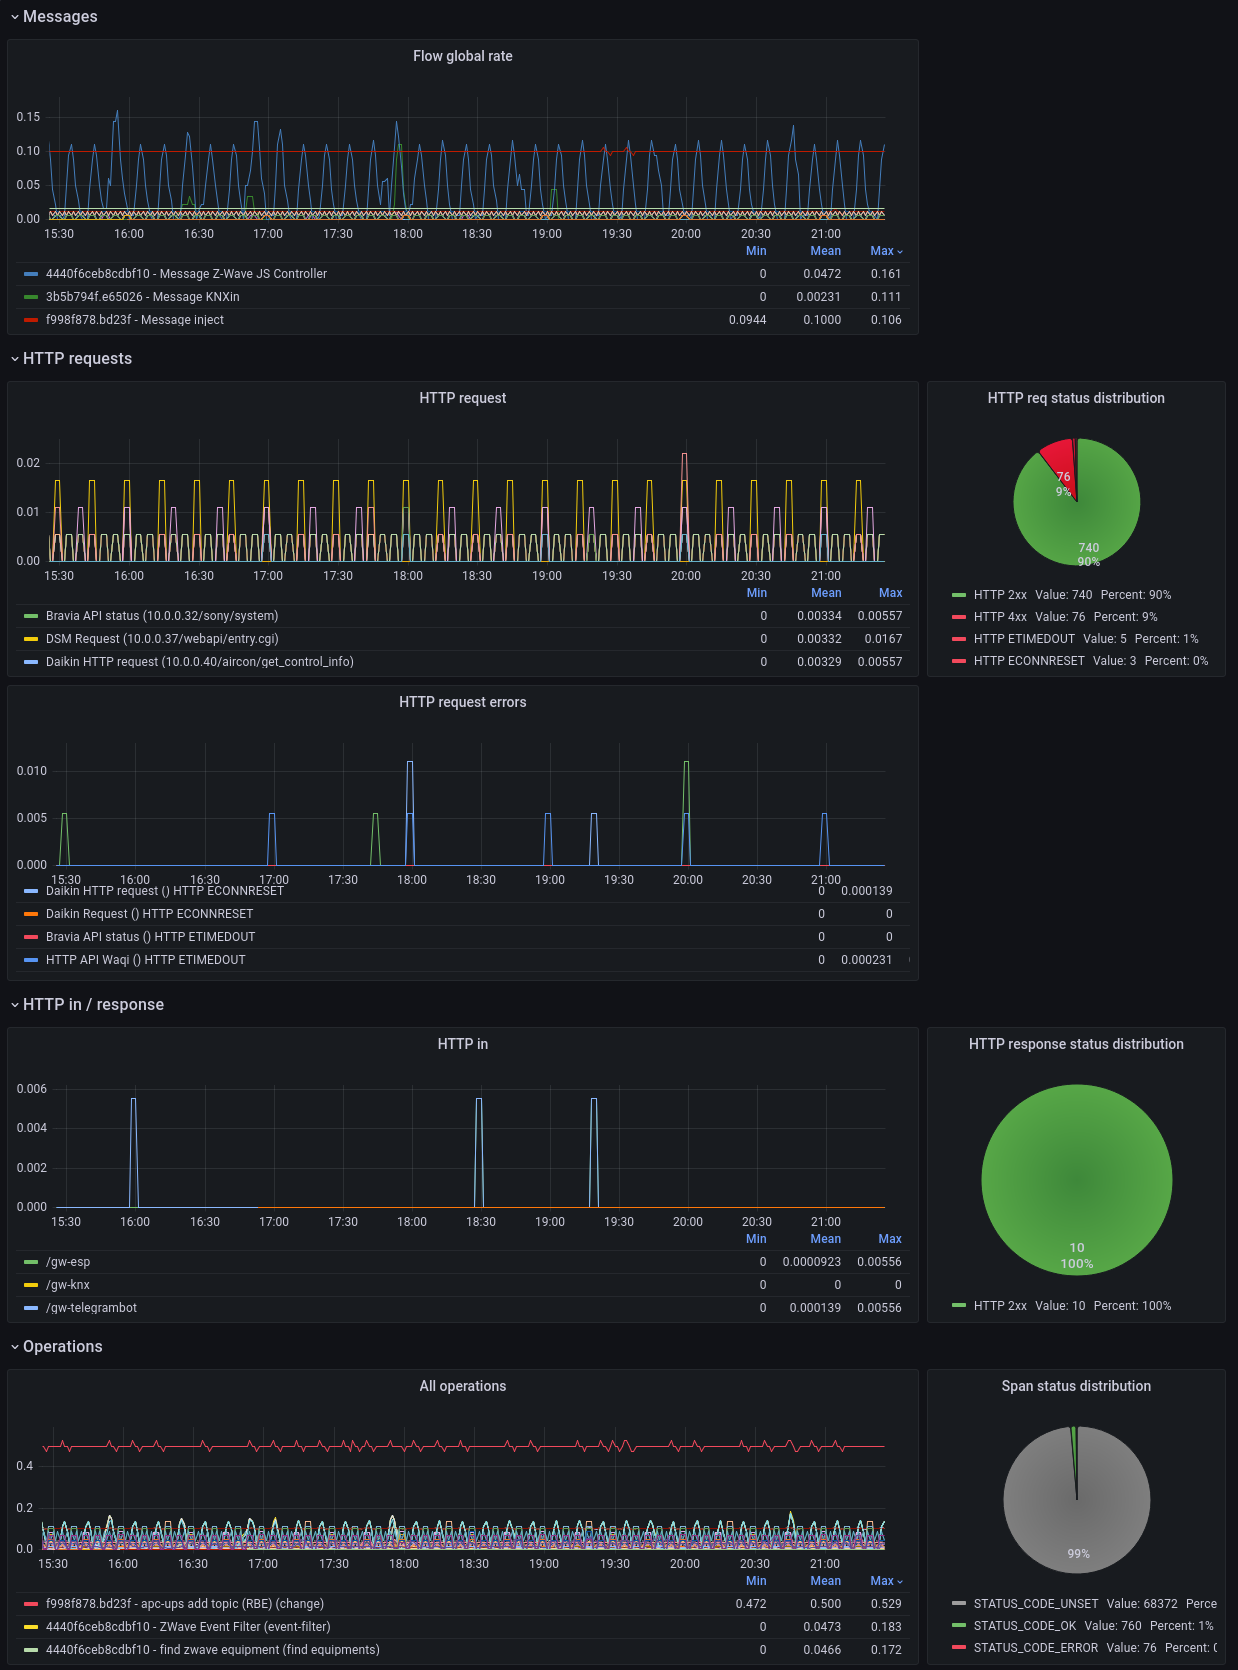
Metrics
- export of request metrics from
http innodes (for Prometheus scraping):- method,
- route,
- status,
- ip
- duration.
curl http://localhost:1881/metrics
# HELP target_info Target metadata
# TYPE target_info gauge
target_info{service_name="Node-RED",telemetry_sdk_language="nodejs",telemetry_sdk_name="opentelemetry",telemetry_sdk_version="1.30.0"} 1
# HELP http_request_duration Response time for incoming http requests in milliseconds
# UNIT http_request_duration ms
# TYPE http_request_duration histogram
http_request_duration_count{method="POST",route="/api/test",status="201",ip="127.0.0.1"} 5
http_request_duration_sum{method="POST",route="/api/test",status="201",ip="127.0.0.1"} 620
http_request_duration_bucket{method="POST",route="/api/test",status="201",ip="127.0.0.1",le="0"} 0
http_request_duration_bucket{method="POST",route="/api/test",status="201",ip="127.0.0.1",le="25"} 0
http_request_duration_bucket{method="POST",route="/api/test",status="201",ip="127.0.0.1",le="50"} 4
http_request_duration_bucket{method="POST",route="/api/test",status="201",ip="127.0.0.1",le="75"} 4
http_request_duration_bucket{method="POST",route="/api/test",status="201",ip="127.0.0.1",le="100"} 4
http_request_duration_bucket{method="POST",route="/api/test",status="201",ip="127.0.0.1",le="250"} 4
http_request_duration_bucket{method="POST",route="/api/test",status="201",ip="127.0.0.1",le="500"} 4
http_request_duration_bucket{method="POST",route="/api/test",status="201",ip="127.0.0.1",le="1000"} 5
http_request_duration_bucket{method="POST",route="/api/test",status="201",ip="127.0.0.1",le="2000"} 5
http_request_duration_bucket{method="POST",route="/api/test",status="201",ip="127.0.0.1",le="+Inf"} 5
Installation
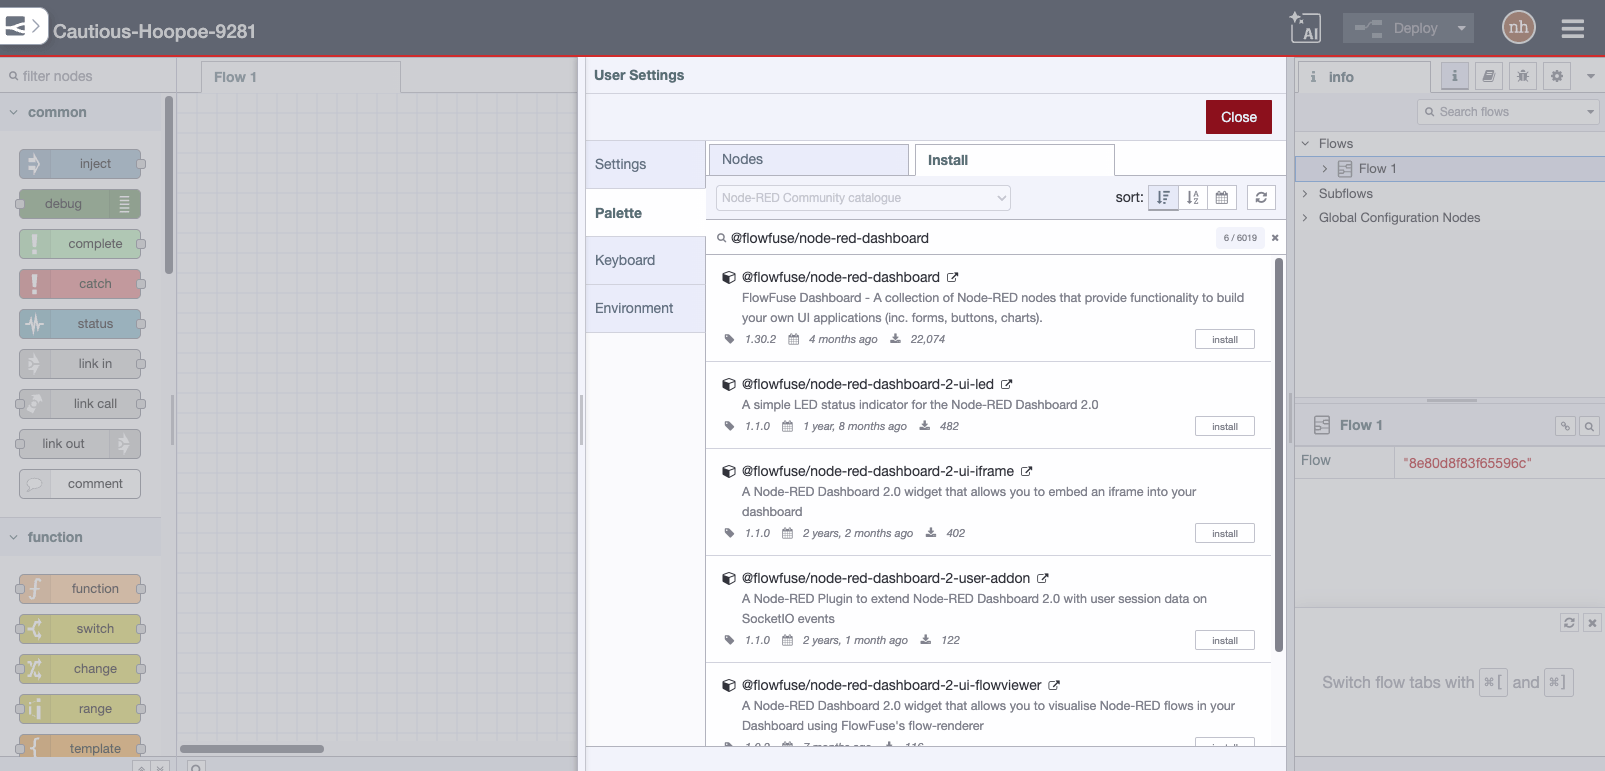
Search node-red-contrib-opentelemetry within the palette manager or install with npm from the command-line (within your user data directory):
npm install node-red-contrib-opentelemetry
As with every node installation, you will need to restart Node-RED for it to pick-up the new nodes.
Usage
Traces
- Add OTEL node once (to any flow),
- Setup the node:
- set OTEL exporter url (example for Jaeger:
http://localhost:4318/v1/traces), - choose an OTLP transport protocol (
http/jsonorhttp/protobuf), - set the
authscheme your collector requires (see Exporter authentication), - define a service name (will be displayed as span service),
- define naming convention for the local root spans:
- optional root span prefix (will be added in Node-RED root span name),
- whether or not to include the flow name,
- define nodes that should not send traces (using comma-separated list like
debug,catch), - define nodes that should propagate W3C trace context (in http request headers, using a comma-separated list; for example:
http request,my-custom-node), - define time in seconds after which an inactive local root span is considered abandoned and closed,
- define custom span attributes you want to send (optionally).
- set OTEL exporter url (example for Jaeger:
Exporter authentication
If your collector requires authentication, select an authentication scheme in the OTEL configuration node:
| Scheme | Header sent |
|---|---|
None |
none |
Bearer token |
Authorization: Bearer <token> |
Basic |
Authorization: Basic <base64 of user:password> |
Custom header |
<header name>: <value>, for example x-api-key: ... |
The secret is kept in the node credentials, so it is stored apart from the flow: it does not end up in flows.json, nor in a flow you export or commit.
It is also possible to send non-confidential headers (such as the name of a dataset, an organization, or a feed) via the additional exporter headers.
Headers set in the OTEL_EXPORTER_OTLP_HEADERS environment variable are still sent, which is convenient for container deployments:
OTEL_EXPORTER_OTLP_HEADERS="authorization=Basic cm9vdDpwYXNz,x-tenant=acme"
A header configured on the node takes precedence over the environment for the same name.
Metrics
- Add Prometheus node once (to any flow),
- Setup the node:
- set Prometheus export port and endpoint (example:
1881and/metrics), - define a service name (will be displayed in export),
- define a instrument name (will be displayed in export),
- set Prometheus export port and endpoint (example:
- Add middleware to your
settings.jsfile:// import the prometheus middleware const { prometheusMiddleware } = require('node-red-contrib-opentelemetry/lib/prometheus-exporter.js') // ... // then add it to the existing httpNodeMiddleware attribute httpNodeMiddleware: prometheusMiddleware, // ...
Versioning
node-red-contrib-opentelemetry is maintained under the semantic versioning guidelines.
See the releases on this repository for changelog.
Contributors
- Nioc - Initial work
- Wodka - AMQP headers and
CompositePropagator(Jaeger, W3C, B3) - Akrpic77 - MQTT v5 context fields
- Joshendriks - Protobuf trace-exporter support
- Czepiec -
node_red.flow.namespan attribute - Syron - Improve flow tracing (per run), exporter authentication, nested spans and tests
See also the full list of contributors to this project.
Direct dependencies
- @opentelemetry (Apache-2.0)
- jmespath (Apache-2.0)
- on-finished (MIT)
License
This project is licensed under the GNU Lesser General Public License v3.0 - see the LICENSE file for details