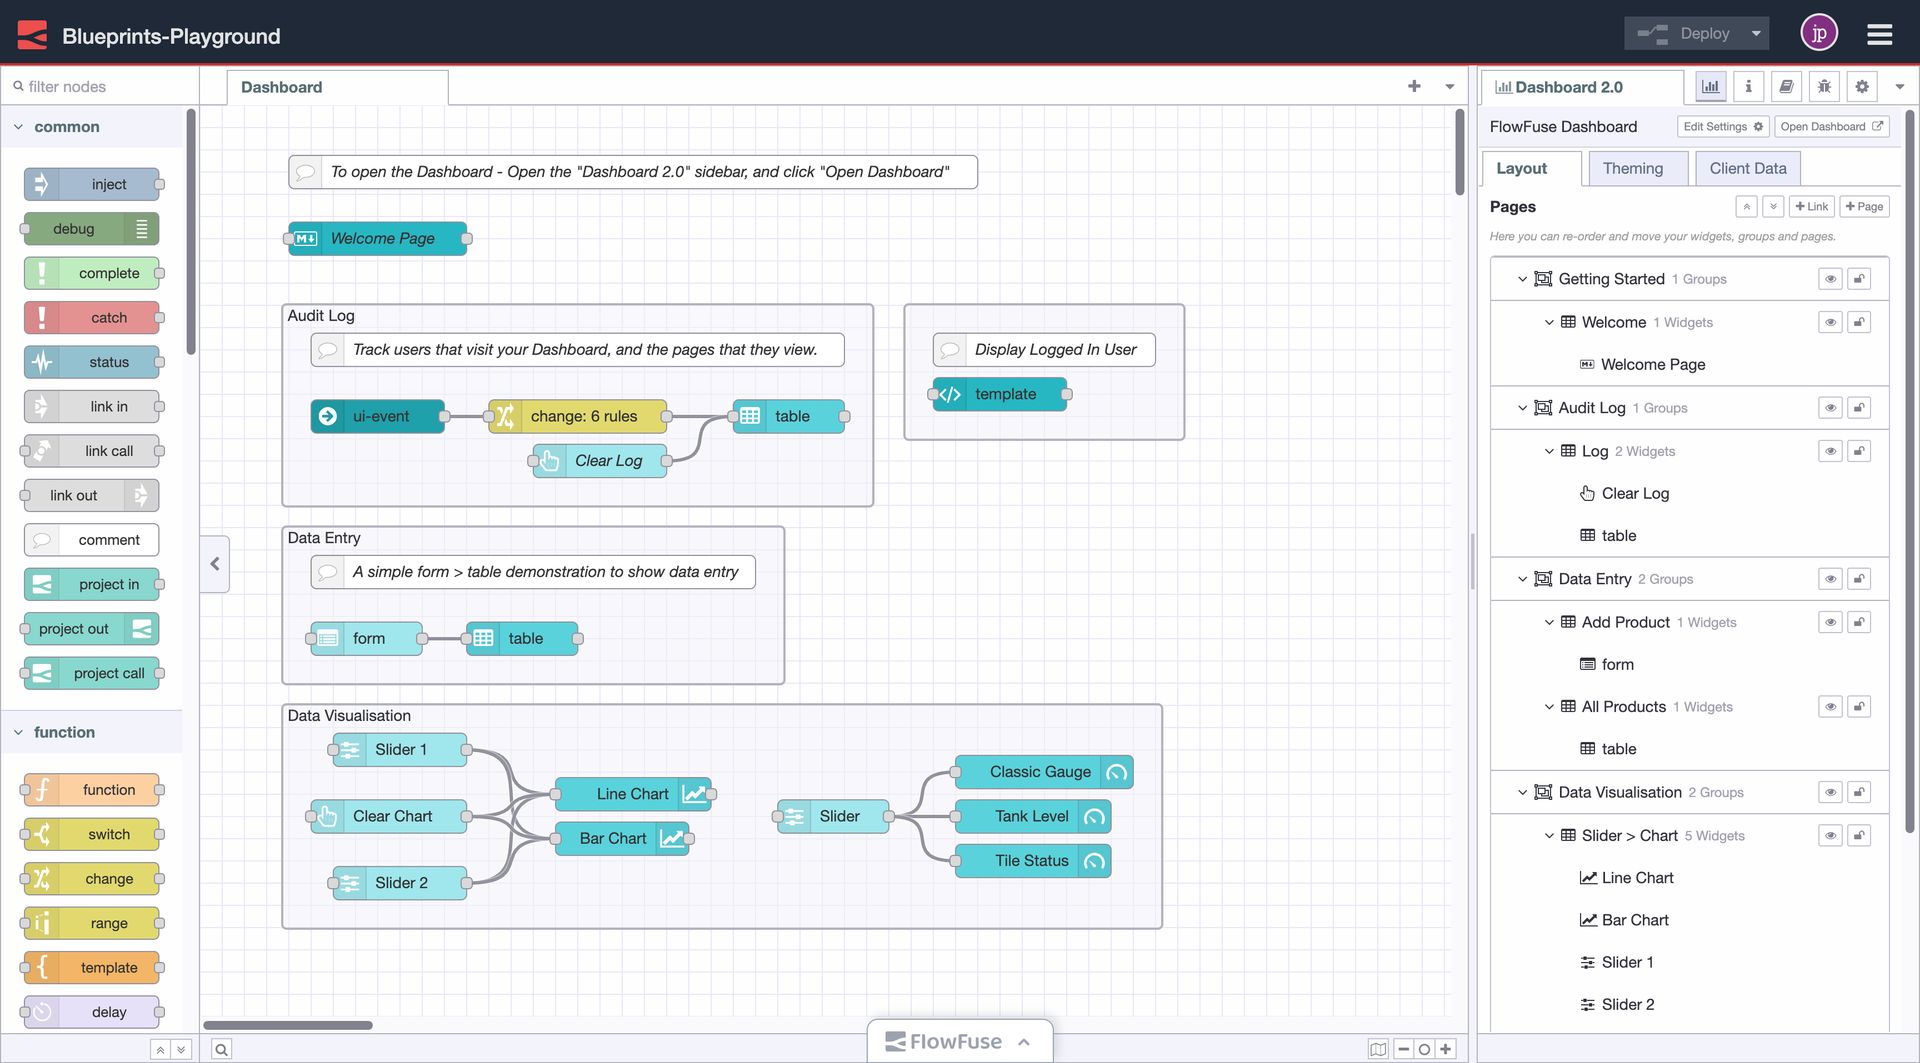
Getting Started with Dashboard
A collection of small examples for how to use FlowFuse Dashboard (Node-RED Dashboard 2.0).
A collection of small examples for how to use FlowFuse Dashboard (Node-RED Dashboard 2.0). Each example is rendered to a standalone page on Dashboard, which can be navigated to via the side menu.
Setup
In order to show the logged in user, you should enable the "FlowFuse User Authentication" setting on your Instance.
Examples
The examples included are as follows:
Data Visualisation
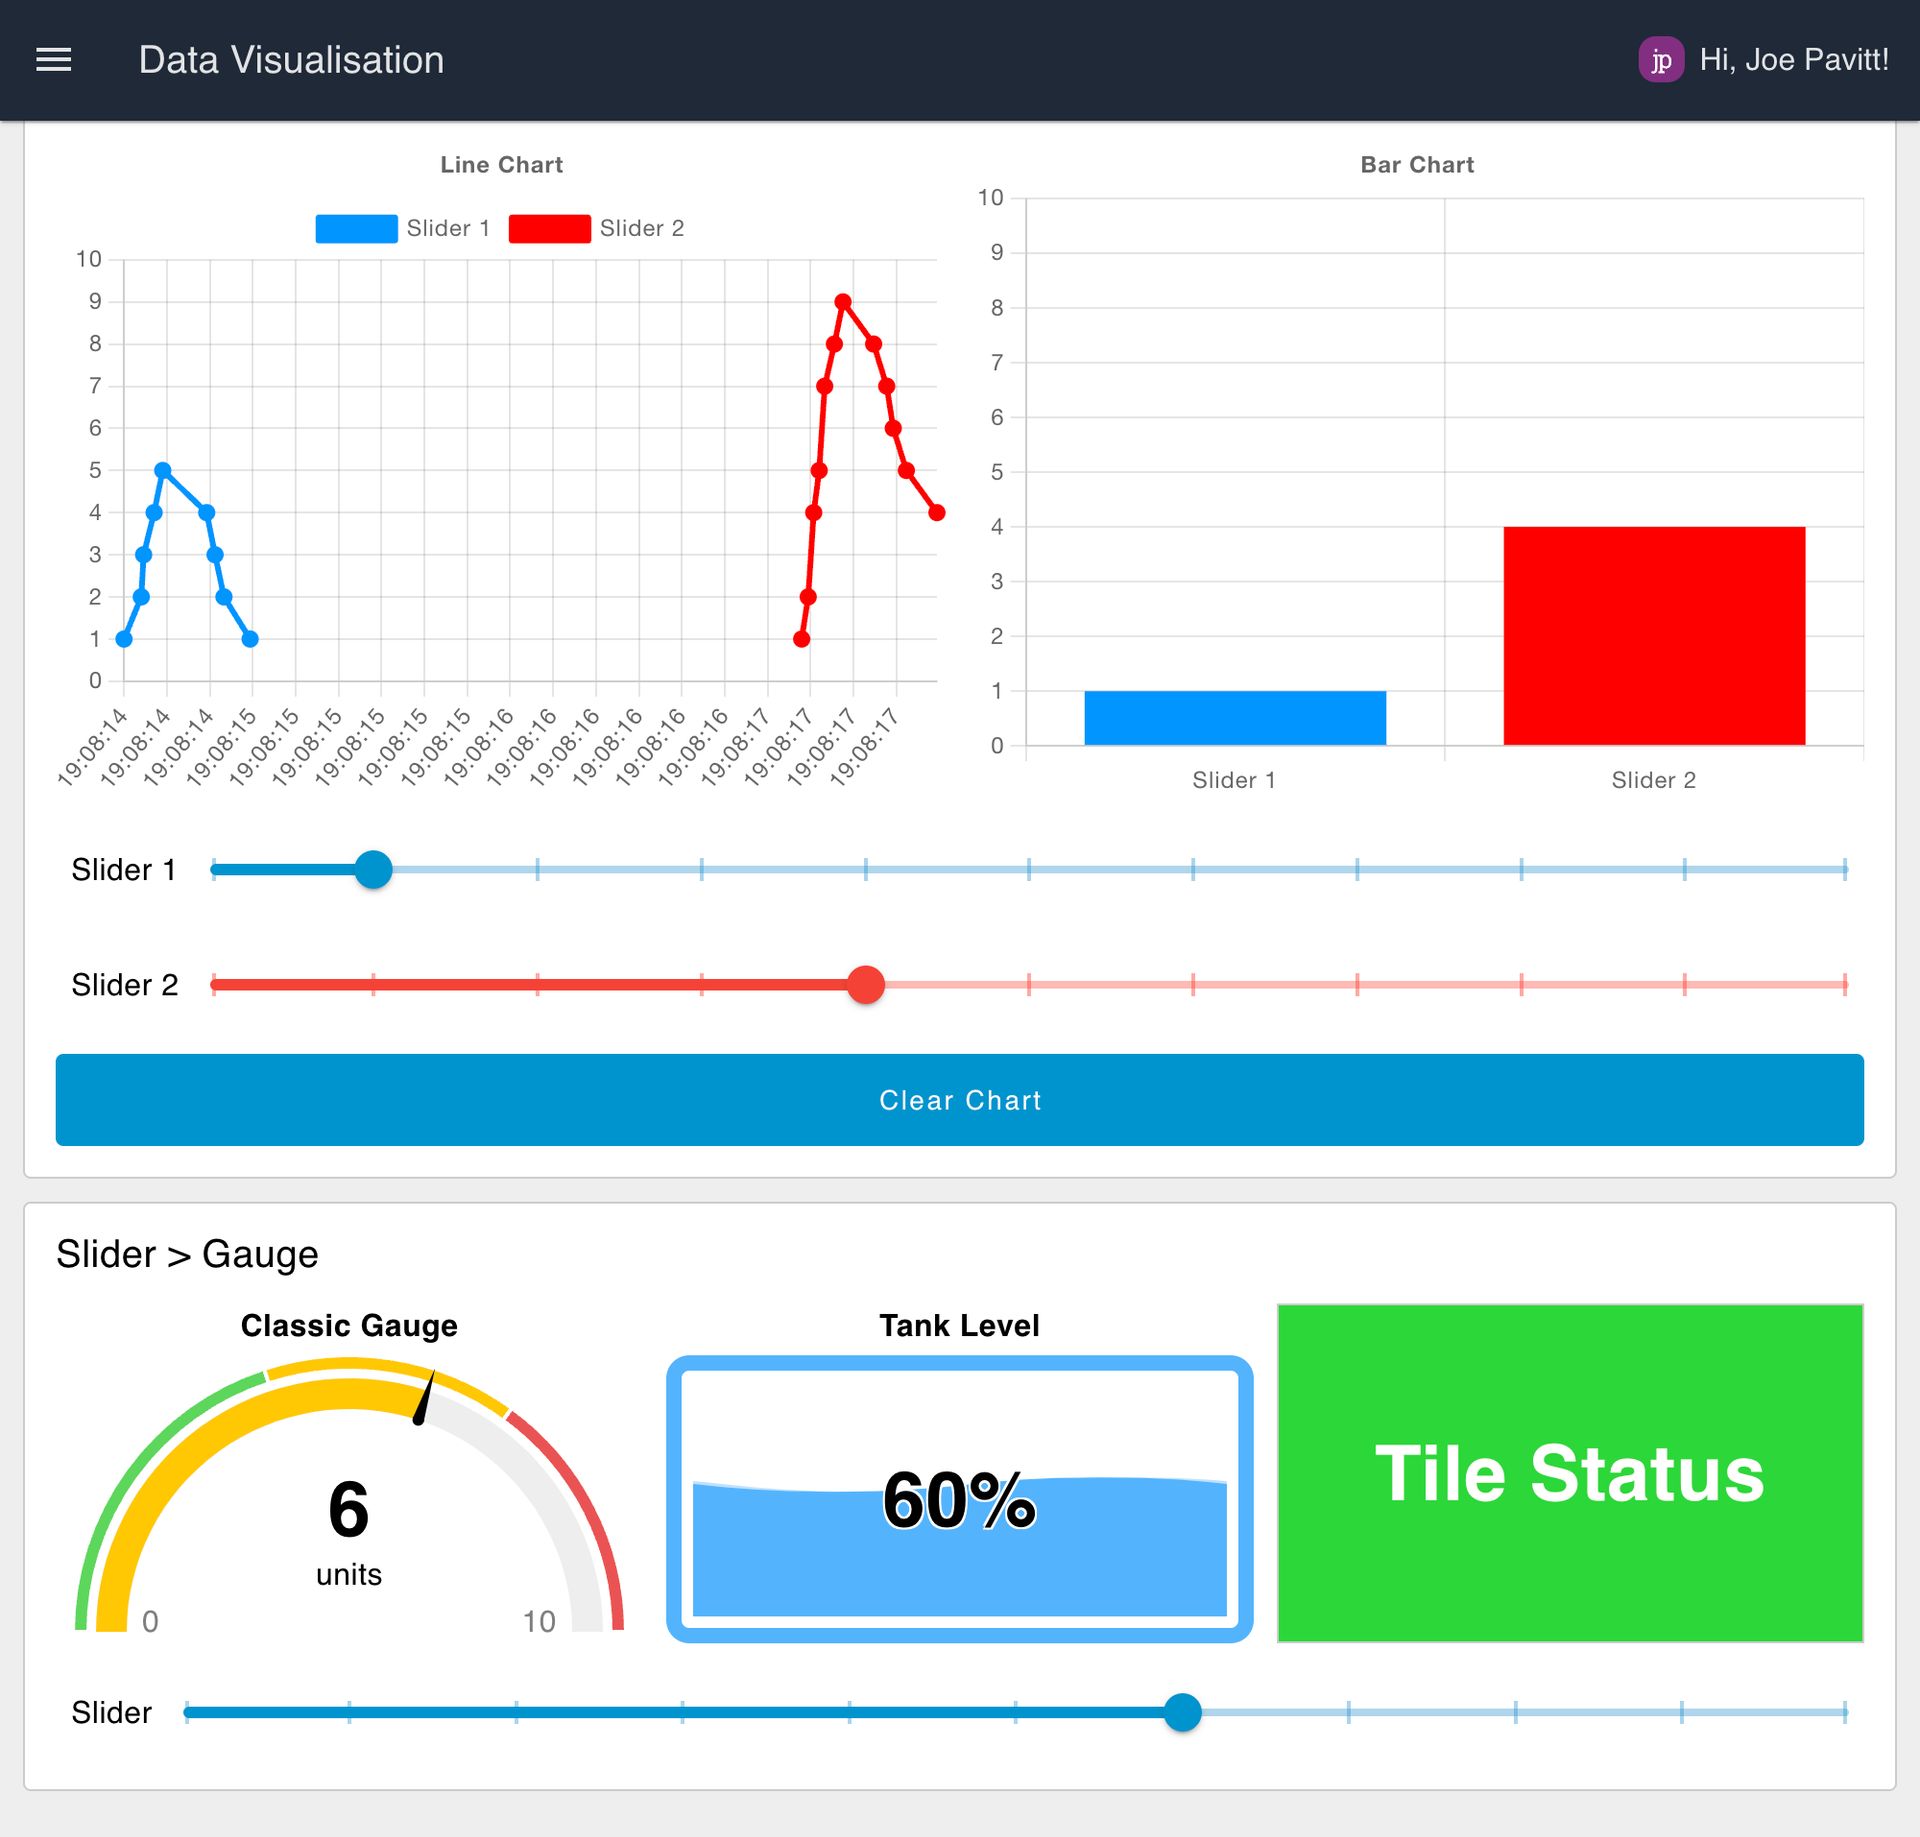
The example demonstrates how to use the chart widget and gauge widget to render data. In this simple flow, a slider is connected to the respective elements to show how interactive and live data can be displayed.
Data Entry Form
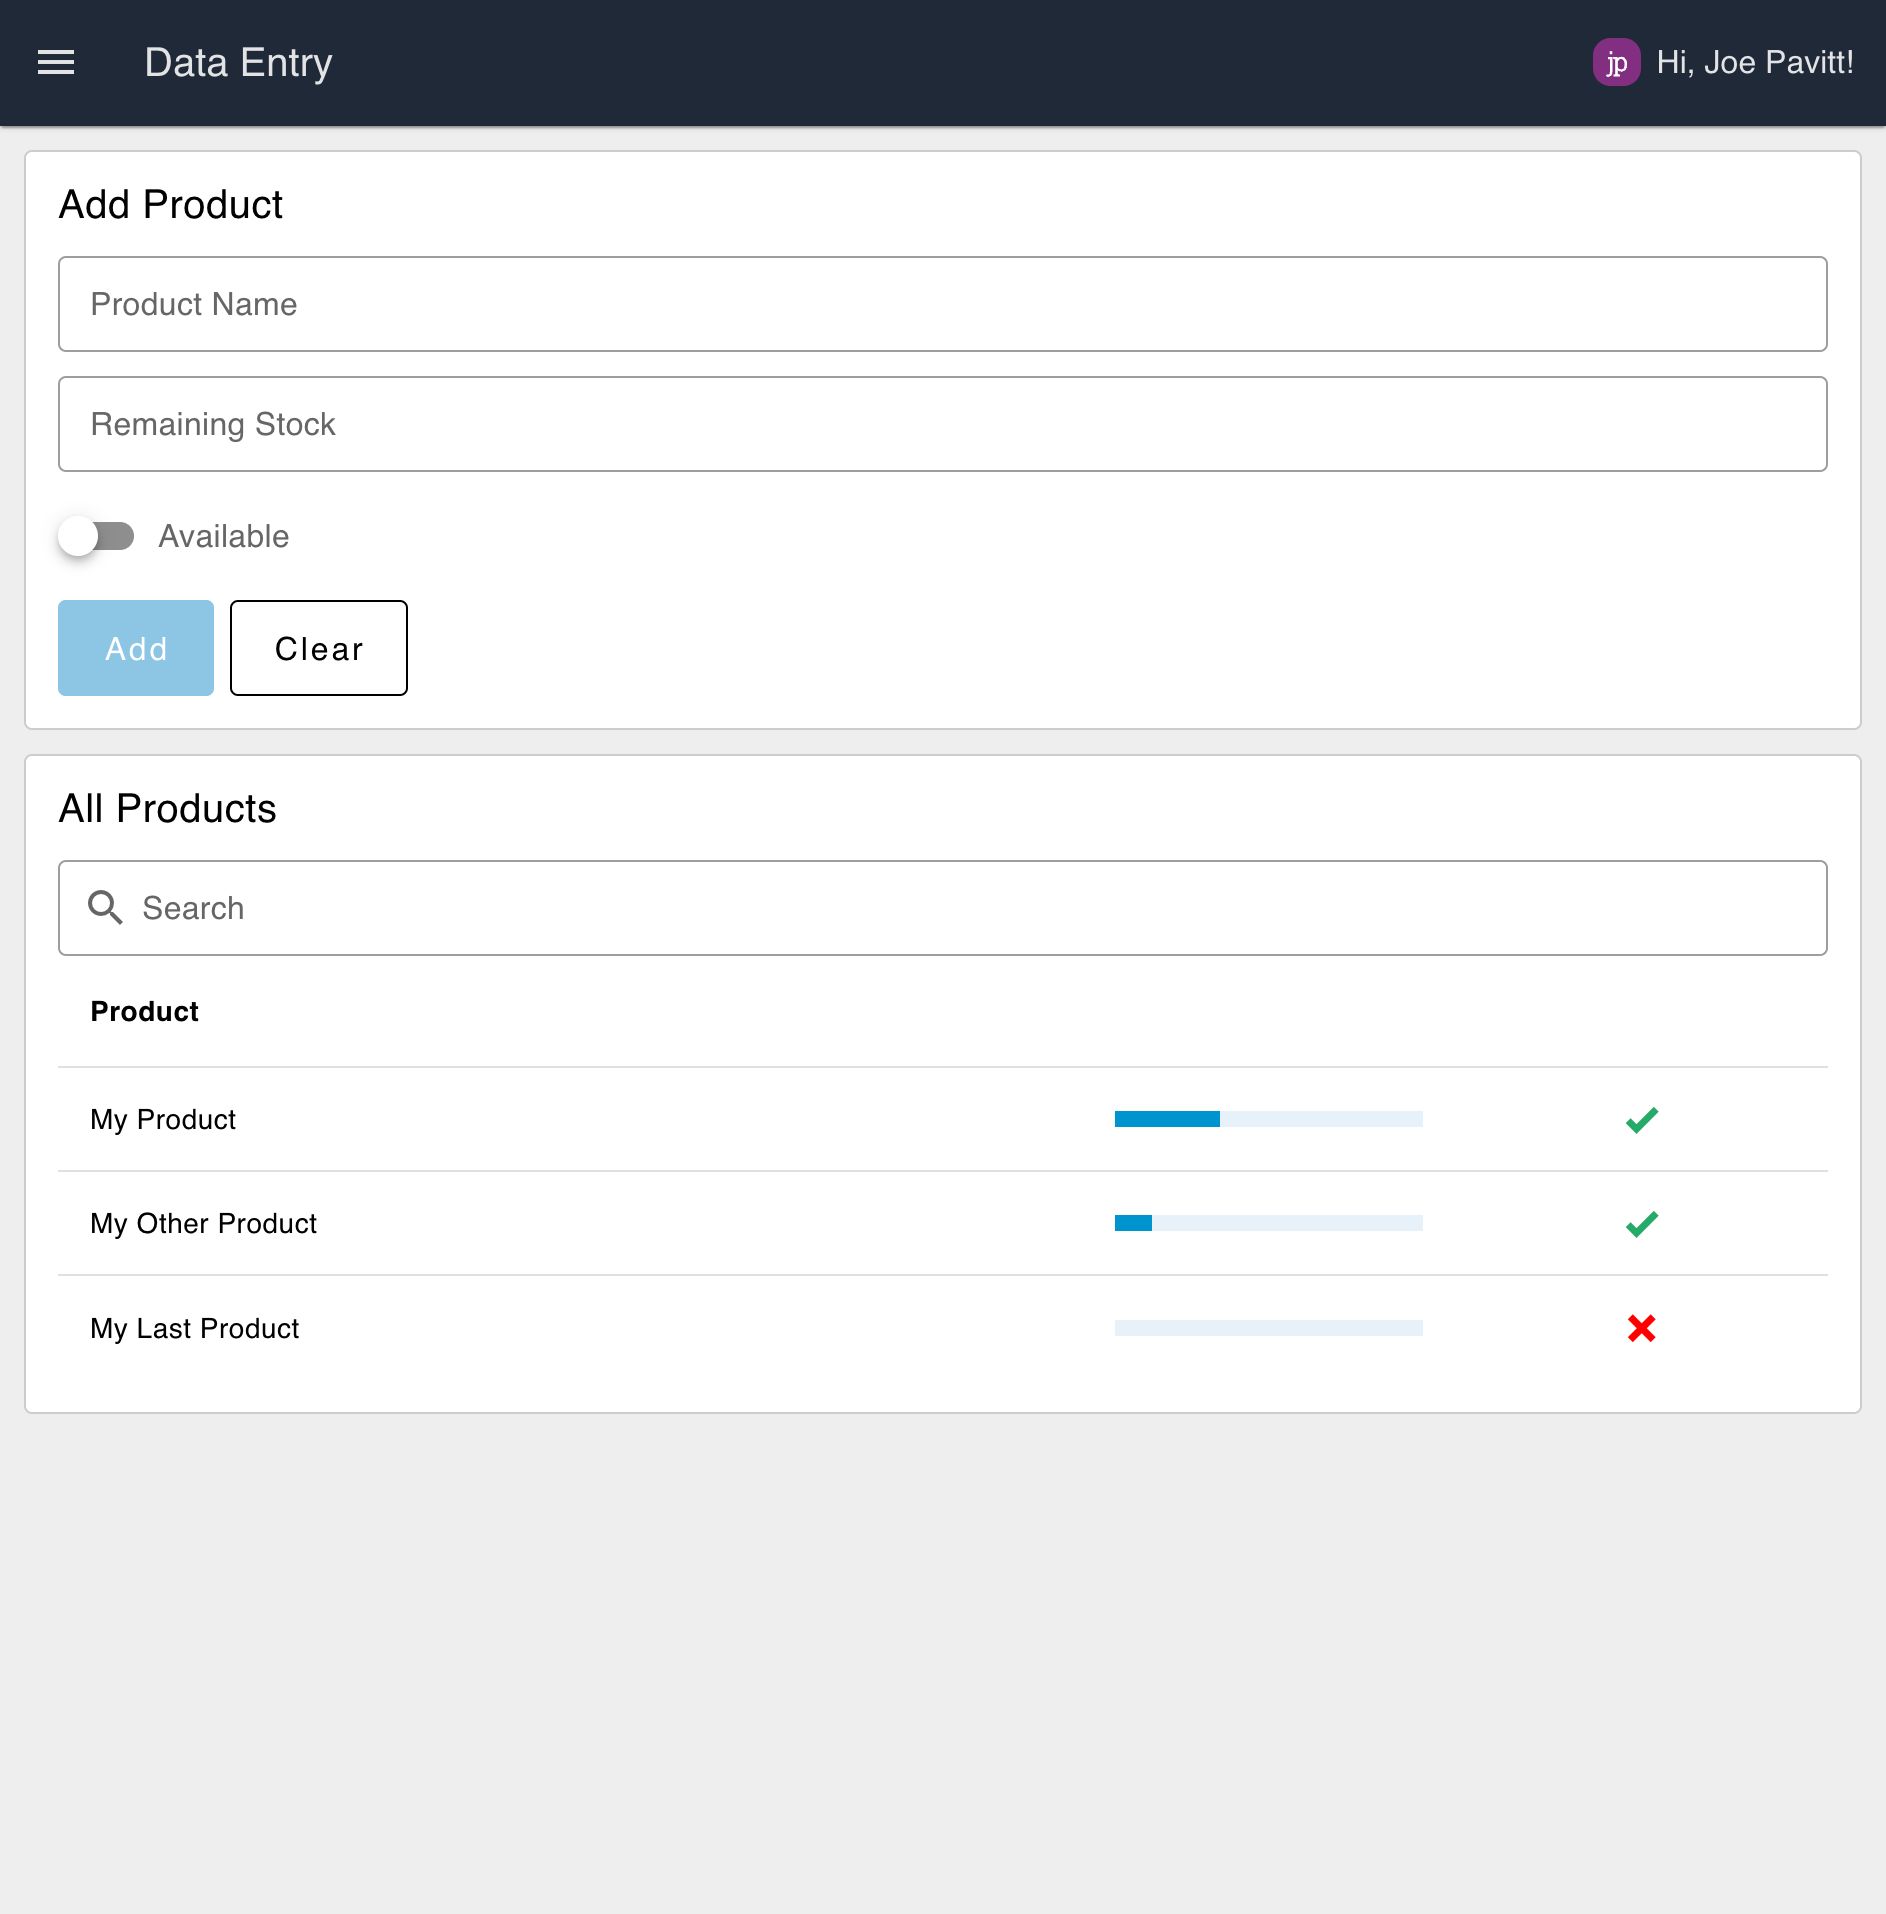
The table has had its columns manually defined such that it renders the "Remaining Stock" column as a progress bar, and the "Available" column as a tick/cross.
User Tracking & Audit Log
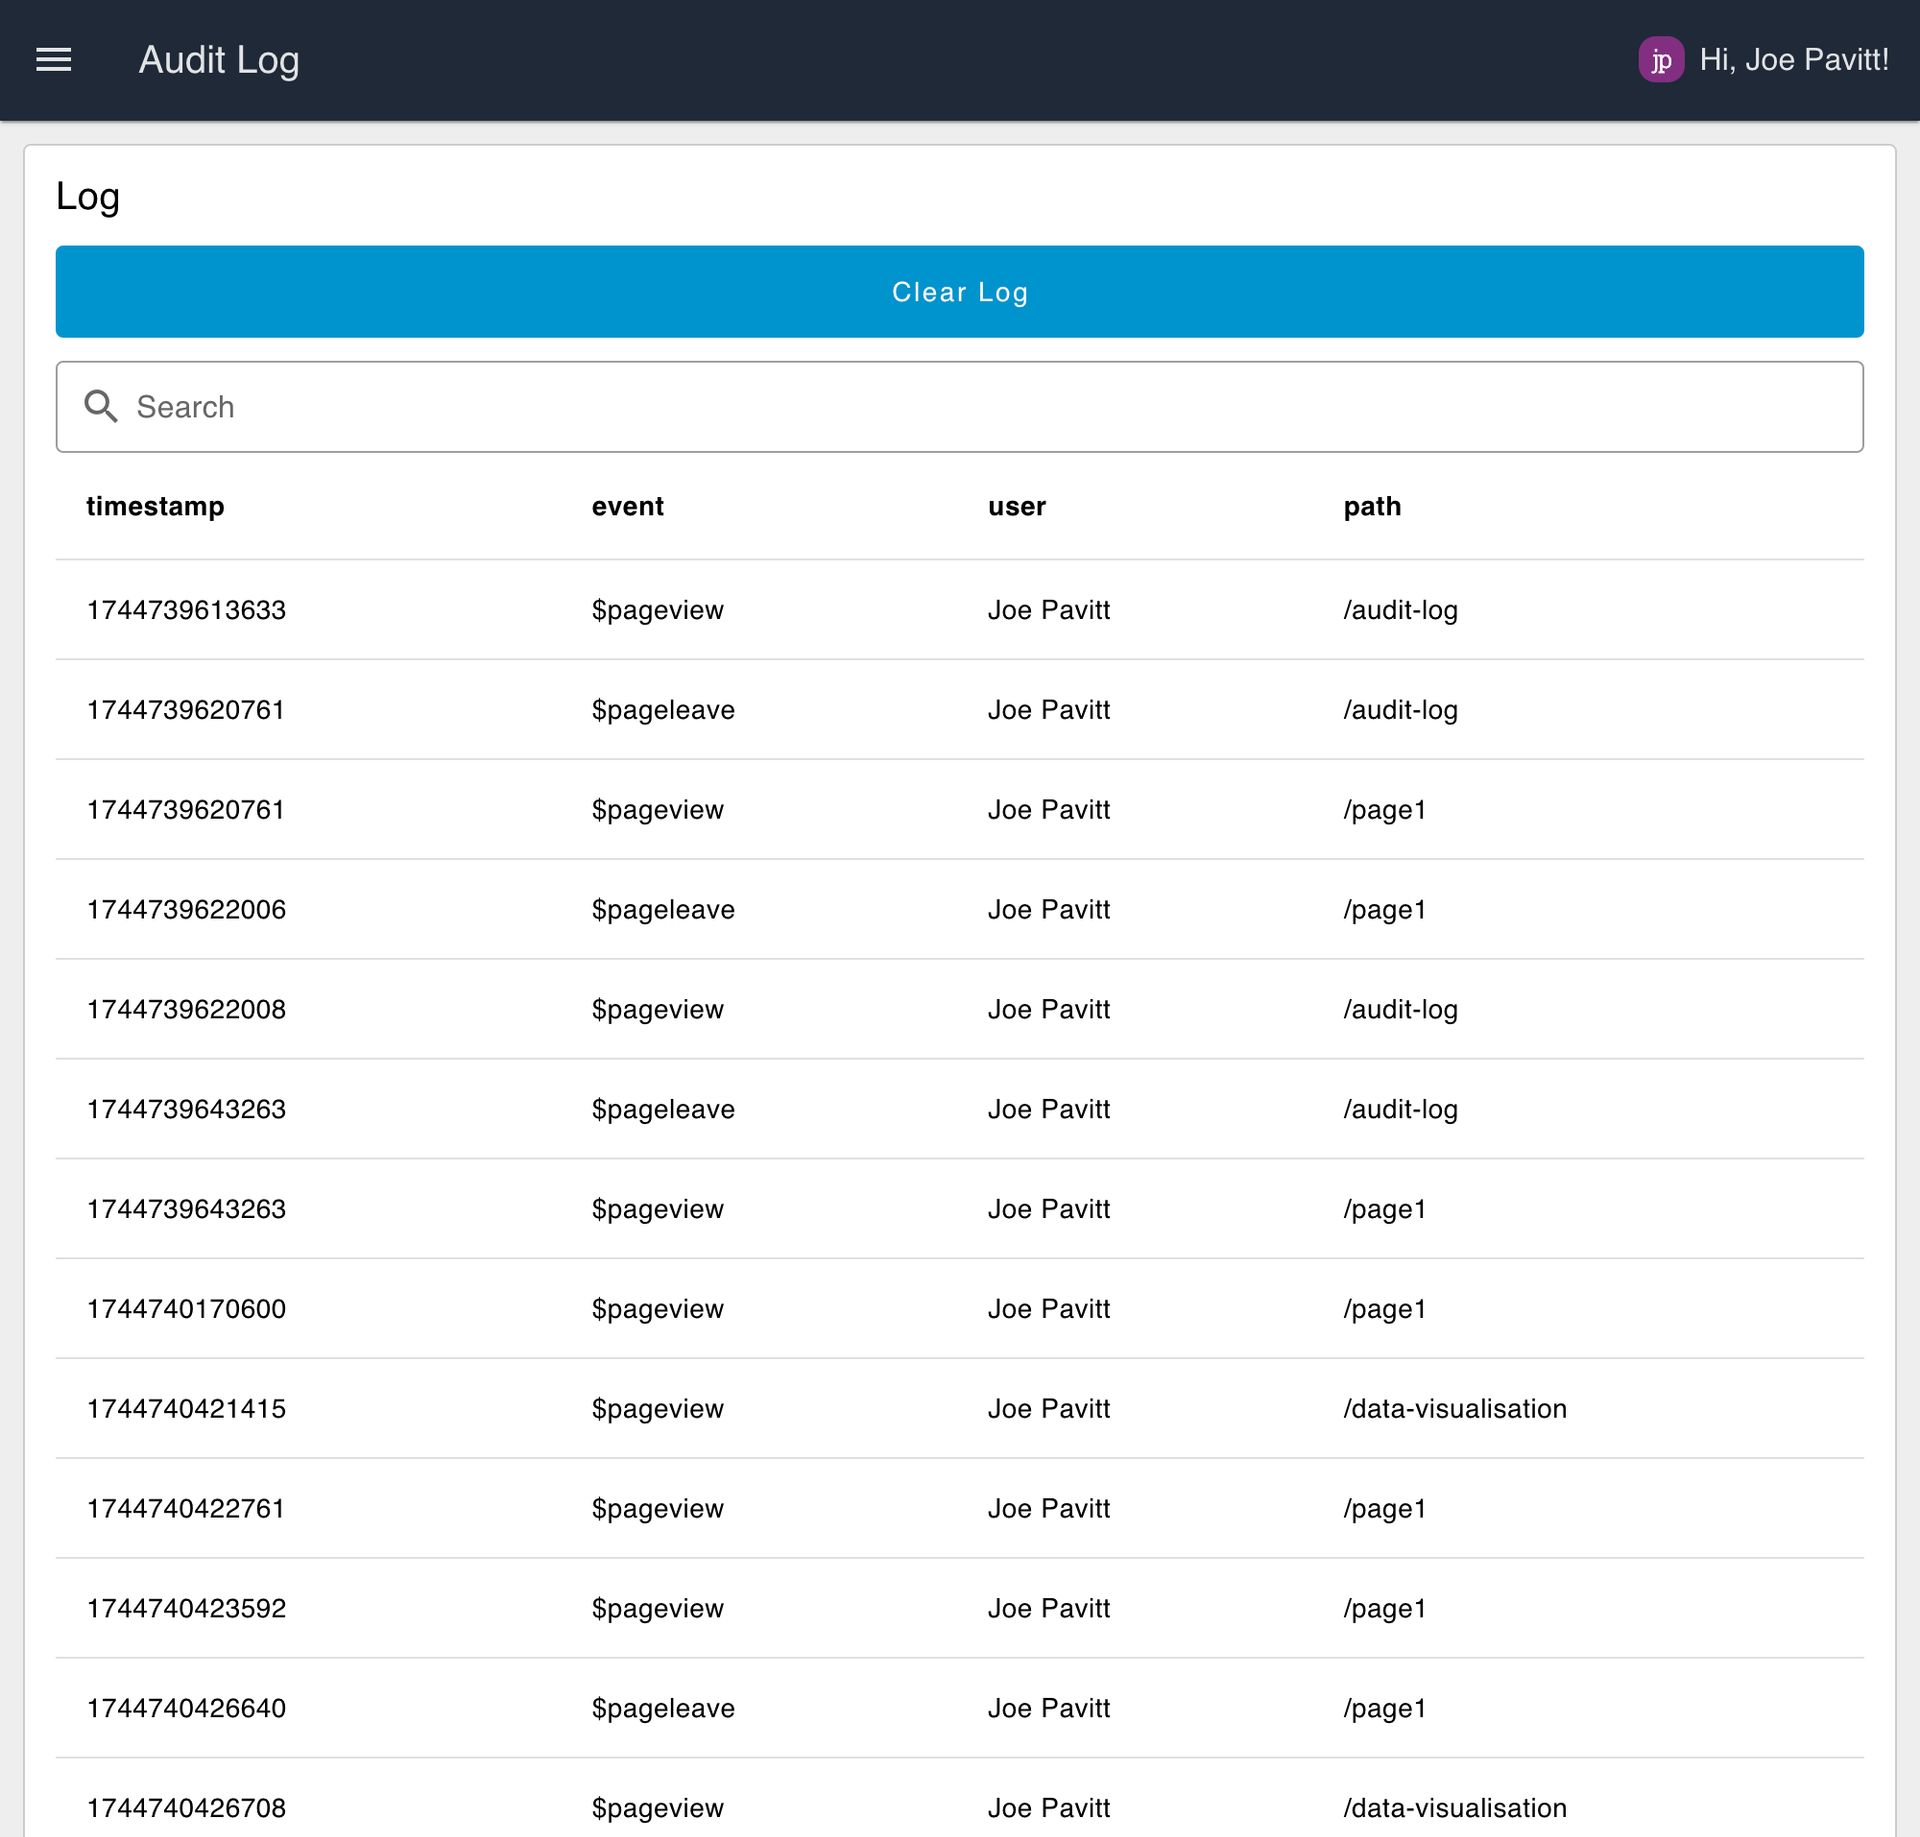
The flow uses Dashboard's event node, which emits when user's view or leave pages in your Dashboard.
Setup
In order to show the logged in user, you should enable the "FlowFuse User Authentication" setting on your Instance:
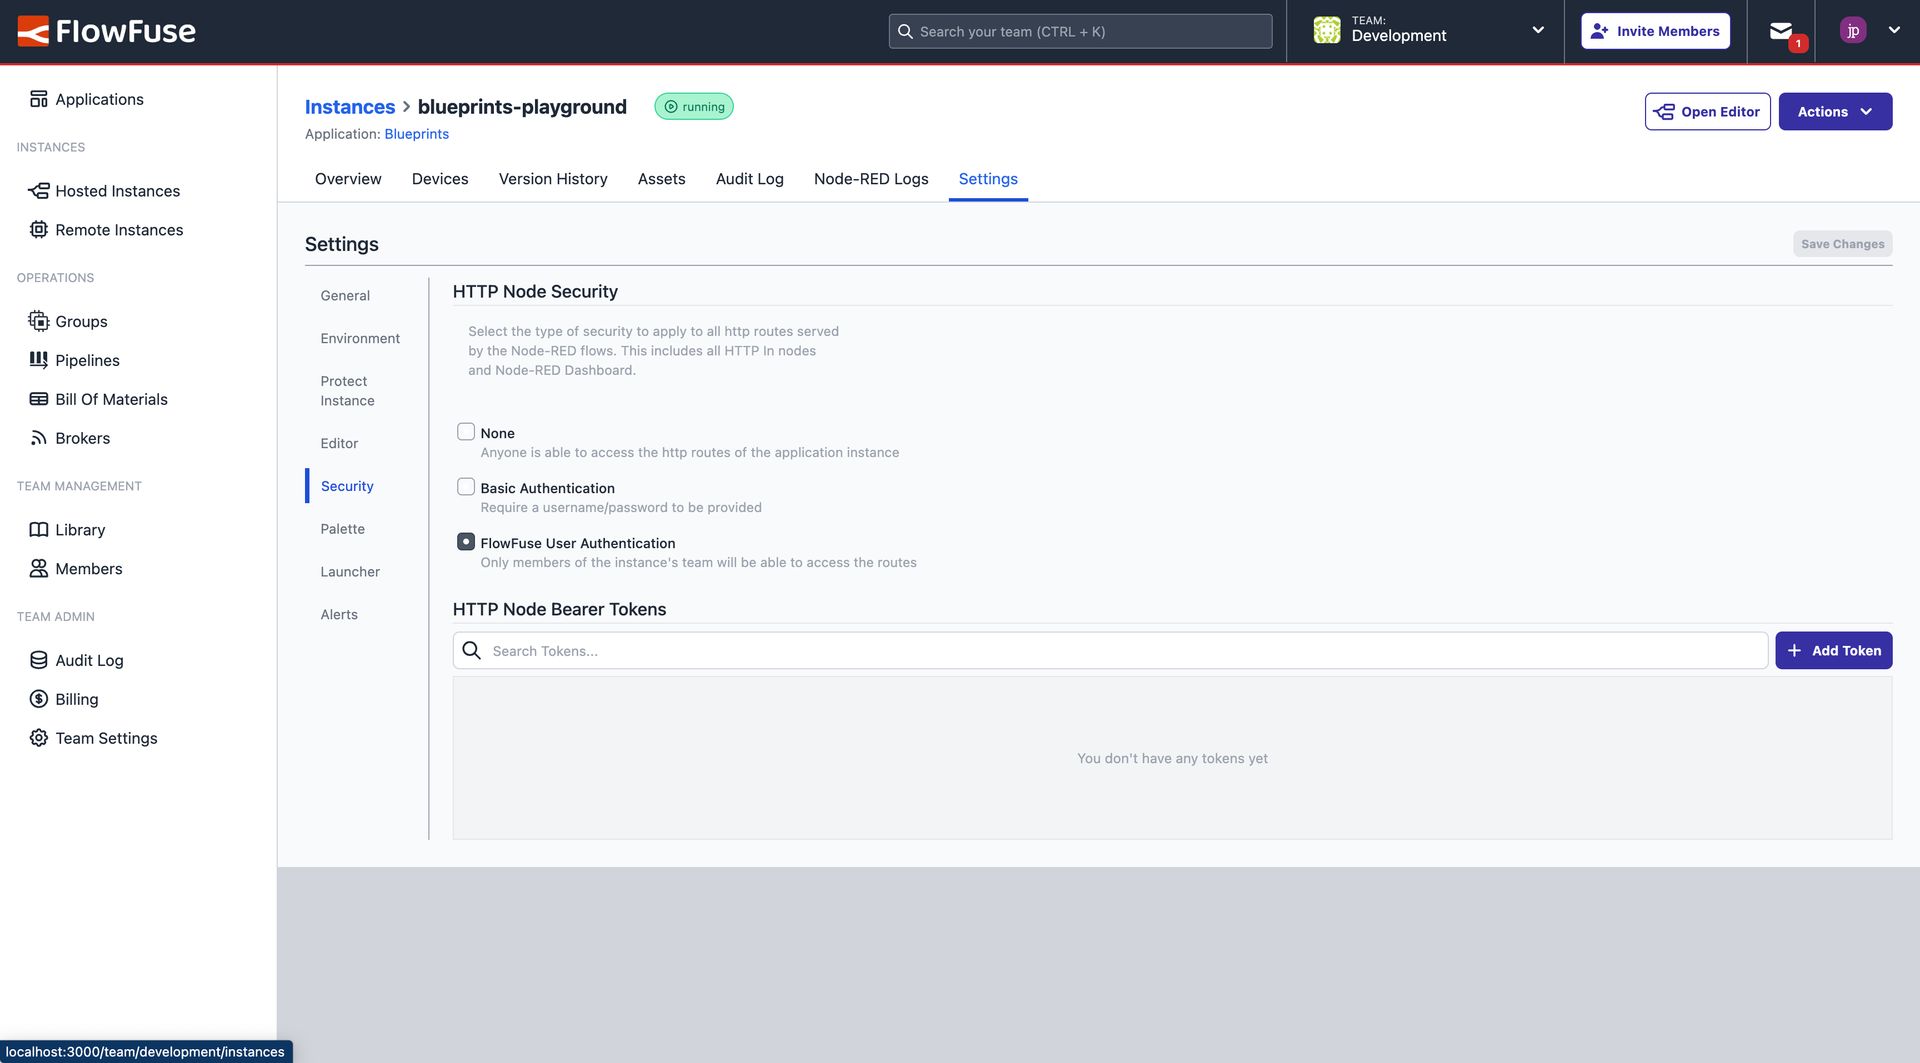
This will add a msg._client.user object to the global context, which can be accessed by your Dashboard. You will need to restart your Node-RED instance for this to take effect.
Author:
Looking for help with your project? Contact us; our experts will be happy to provide a solution for your needs.