Bringing Software Development practices to Node-RED
Applying lessons from traditional development to the low-code space.

I'm always thinking about how we can continue to improve the Node-RED experience. One area I like to explore is to make sure we learn the right lessons from the Software Development world.
In this post, I'm going to look at some of the common practices in modern Software Development and show how they translate to the Node-RED world.
Linting
Linting is a way of examining some code and automatically spotting things that need attention. This can range from stylistic errors ("Use tabs, not spaces") to real bugs that will prevent the code from working as intended.
This is all about spotting problems before the code runs. It also helps ensure consistency when you have multiple people contributing to the code.
Having code that is consistently formatted and free of syntactic mistakes makes it much easier to maintain.
Applying this concept to Node-RED, we have the nrlint tool. This is a linting tool that can run either on the command-line or within the editor directly to spot potential problems with the flows.
On the stylistic side, for example, it can highlight nodes that aren't properly aligned to the grid. Whilst this doesn't have any bearing on the runtime operation of the flow, it encourages keeping the flows tidy and orderly.
It can help identify potential infinite loops in flows, and highlight Debug nodes without a name set.

Debugging
Whether you are writing lines of code or not, eventually you will need to figure out why your application isn't doing what you think it should.
In Software Engineering there are two typical approaches. One is to add debug statements through the code to print out bits of information as the program runs. Then, depending on what output you got, you'd move the debug statements around, add some more, print out different bits of information - all until you'd nailed down the problem. This is the Debug node approach in Node-RED; adding nodes at different points of your flow to capture some piece of information and then iterating as you go.
This is probably how most Node-RED users go about it today. The downside is you end up leaving the Debug nodes in place, capturing information long after it is needed.
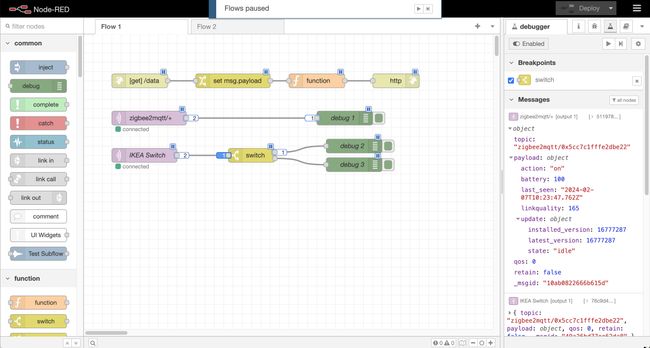
The alternative approach is Step-by-Step debugging. This is why you are able to pause the program and then step it forward one statement at a time - examining the state at each point. But what's the equivalent for low-code? Pretty much exactly that when you have the Node-RED Debugger plugin installed.
This allows you to set 'breakpoints' on any node input or output that are triggered when a message arrives at that point of the flow. The Debugger will then pause the whole runtime and shows you all of the queued up messages in the flow.
You can then examine those messages and tell the Debugger to 'release' them one at a time - seeing how the flow progresses.

Testing
Testing code is a critical part of developing software. You want to make sure it does what you want. But it's more than just manually testing it once and then letting it go; you want to have tests you can run regularly, whenever you make changes, to ensure you don't break something that was working previously.
In the Software Development world, there are all sorts of testing methodologies and techniques; unit testing individual components, system testing larger sections, stubbing out components to simulate different conditions, integrating test suites into the whole development process.
They each have their own place in the process of software development. The question is, how does this apply to Node-RED?
Most Node-RED users today will of course be testing their flows whilst developing them - iterating until the flow does what is needed. It's far less common to have a set of repeatable tests including the flows.
That is certainly achievable with Node-RED today, albeit with some limitations. For example, a typical test will be to verify that, given a set of particular inputs, the outputs look correct. This can be done using Inject nodes to quickly trigger messages with different values, and use Debug nodes to examine the results.
That isn't ideal as you end up littering your flows with these extra Inject nodes, and it still requires manually verifying the results. It also doesn't work well if your flows need to interact with external systems - such as saving values to a database. You don't want to pollute your system with test data.
So what would be the ideal workflow? This is something the project has spent some time exploring in the past, and the start of a design was put together.
The concept would be to introduce a Testing sidebar to the editor. Within that, you can define a set of test cases. Then for each test case, you can customise the behaviours of individual nodes. For example, a test case may disable an MQTT node at the start of a flow, and tell the runtime to inject a message in its place. For each subsequent node in the flow, the test case would then be able to either to bypass it (to avoid interacting with external systems), or to add checks on what the node outputs. Each test case would then define some criteria for what it means to pass the test.
As with the Debugger plugin, the Test Runner would be disabled by default - so the 'production' flows aren't modified in anyway. When the Test Runner is enabled, it would then take care of running each test in return and reporting back the results.
The main challenge is providing a user experience that makes it easy to create these tests in a way that is consistent with the low-code nature of Node-RED.
Whilst this is very much a future roadmap item for Node-RED, it is one I hope we can start moving forward soon. Having a good, repeatable, testing strategy in Node-RED will make it stand-out from many of the other low-code tools and platforms available today.
Low-Code vs Lines-of-Code
The low-code nature of Node-RED means it is easily accessible to a wide range of users. You don't need to be a seasoned software engineer to get started.
If you have a task to solve, and understand it well enough to break it into the right set of steps, translating that into a Node-RED flow can be much easier than having to write all of the corresponding code from scratch.
Just because you aren't writing code in Node-RED, it doesn't mean you shouldn't be able to benefit from ways of working that are proven to improve the end result - whilst keeping true to the low-code nature of the project.
FlowFuse Cloud
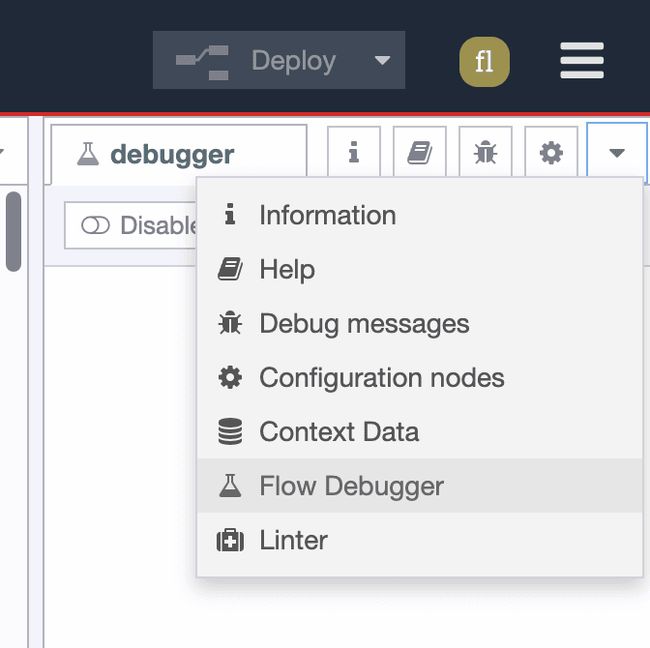
Both nrlint and Node-RED Debugger are already pre-installed in all FlowFuse Cloud hosted instances. You can start using them today via the sidebar menu.

Discuss your use case with our team
See how FlowFuse can support your architecture, integrations, and deployment needs.
Table of Contents
Related Articles:
- Cloud, Edge, or Both? How to Choose Your Deployment Before an Outage Does It For You
- How to Stop Noisy Sensor Data from Flooding Your Industrial System
- IT vs. OT: Who Actually Owns the Edge?
- How to Connect Industrial Edge Devices to AWS IoT Core
- FlowFuse 2.29: FlowFuse Expert Comes to Self-Hosted Enterprise
