Historical Data Logging with OPC UA and InfluxDB
Turn live equipment readings into a durable history you can query, chart, and analyze
Real-time OPC UA values tell you what's happening now; the history is where the value lives. This guide connects OPC UA to InfluxDB in FlowFuse to turn live equipment readings into durable, timestamped history. Install the InfluxDB and FlowFuse Edge Certified OPC UA nodes, configure an OPC UA endpoint and read tags on a schedule, shape each reading into fields and tags with a function node, set the point's timestamp from the server's sample time, and write to InfluxDB with the influxdb out node. Verify the data lands in the Data Explorer, then query it back into FlowFuse Dashboard to chart trends and catch slow drift before it becomes a fault.
Industrial equipment produces data constantly: temperatures, pressures, motor speeds, tank levels, all changing by the second. Real-time values tell you what's happening now, but the history is where the value lives, spotting a degrading pump, proving a batch stayed within spec, tracing the conditions behind a fault. OPC UA gets that data out of your equipment in a vendor-neutral way, and InfluxDB stores it as timestamped history built to query at scale. In this article, you'll connect the two in FlowFuse to turn live readings into a durable record you can query, chart, and analyze.
Note: If you'd rather not leave FlowFuse and want a good time-series database built in, FlowFuse Tables is the answer.
What you'll need
Before building the flow, make sure you have:
- A FlowFuse remote instance on an edge device. OPC UA servers and PLCs sit on the local network, so run this flow on an edge device close to the equipment. Install the Device Agent and register it as a remote instance.
- An OPC UA server to read from. Your data source: a PLC, gateway, or device exposing tags over OPC UA. No hardware? The free Prosys OPC UA Simulation Server works for testing.
- A running InfluxDB instance. Cloud or self-hosted. Create an organization, a bucket, and an API token with write access.
- Endpoint details for both. The OPC UA endpoint URL (like
opc.tcp://192.168.1.10:4840) plus any credentials, and your InfluxDB URL, org, bucket, and token.
For the OPC UA connection, this guide uses the FlowFuse Edge Certified Nodes package, part of the FlowFuse Edge offering and vetted, maintained, and tested by the FlowFuse team. Contact sales to enable it for your team. Community nodes work too, but they don't get the same vetting, maintenance, or testing, so reliability varies.
With those ready, the next step is installing the nodes that connect FlowFuse to OPC UA and InfluxDB.
Installing the nodes
You'll install two packages: the InfluxDB nodes and the FlowFuse Edge Certified OPC UA nodes.
- Open the editor on your remote instance.
- From the menu (top right), select Manage palette, then switch to the Install tab.
- Search for
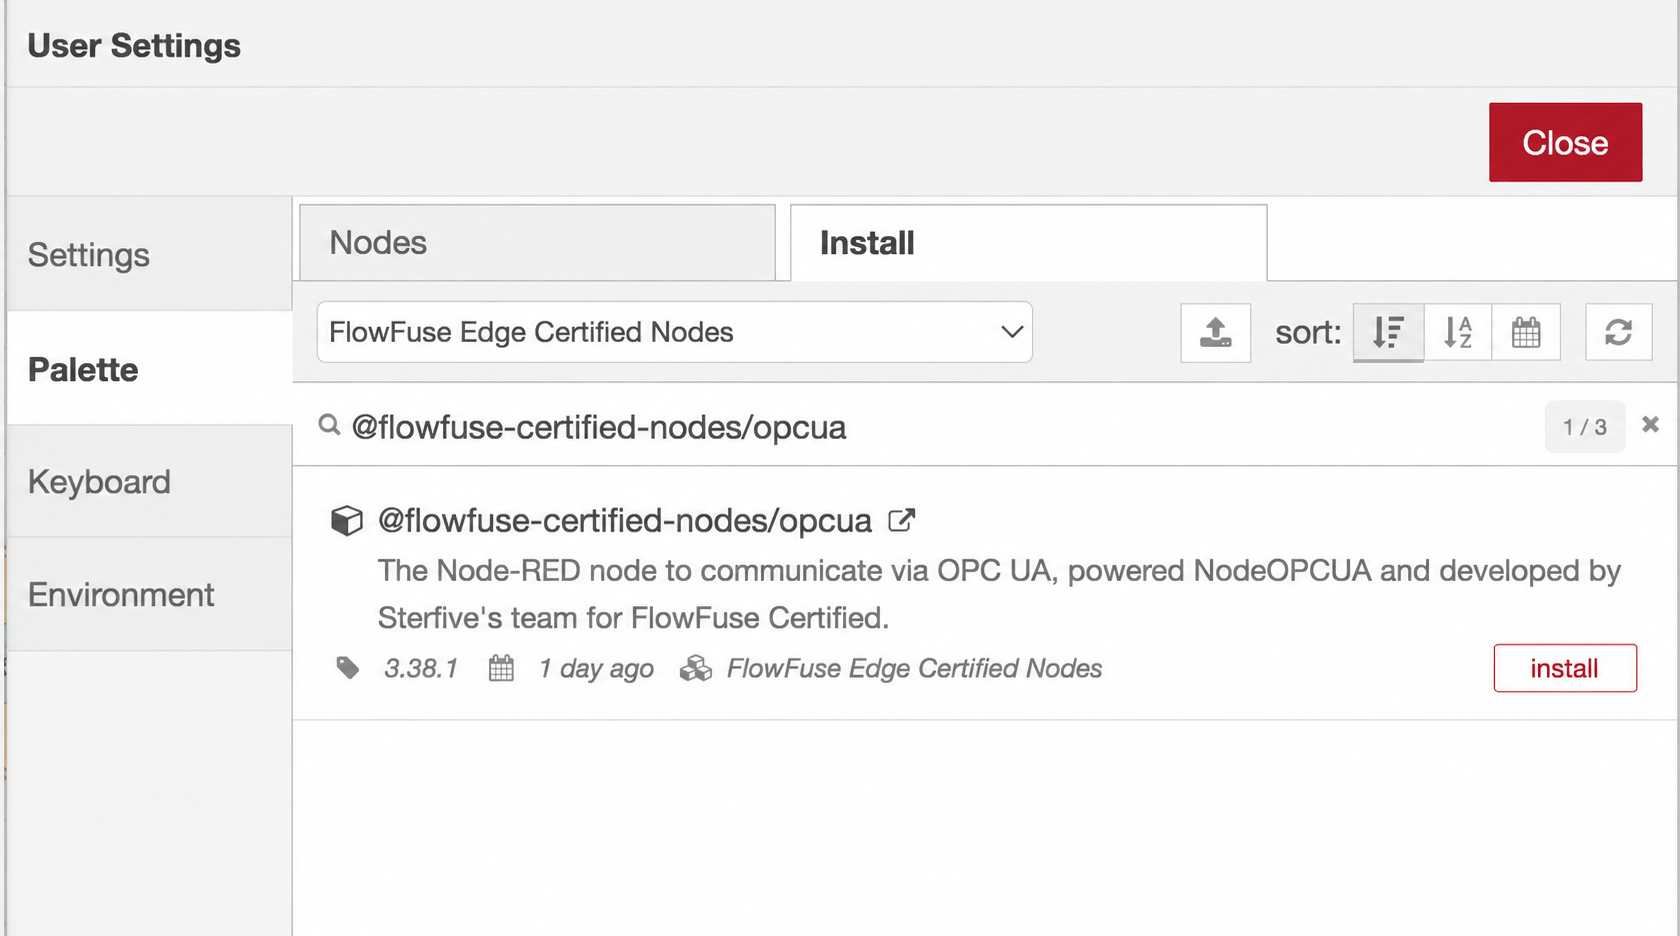
node-red-contrib-influxdband click Install. These nodes write to and query InfluxDB. - Switch the catalog using the top dropdown to FlowFuse Edge Certified Nodes. Once sales enables FlowFuse Edge Certified Nodes for your team, this catalog shows up here; restart any existing instance so it picks up the updated catalogue.
- Search for
@flowfuse-certified-nodes/opcuaand click Install. See the OPC UA node documentation for the full node set and configuration options.
Both packages now appear in the palette on the left: an OPC UA group for reading your equipment, and an InfluxDB group for storing the data. Now you're ready to connect to your server and pull live values.
Connecting to your OPC UA server
With the nodes installed, you'll build the read side of the flow: define the connection, then read your tag values on a schedule.
Define the connection
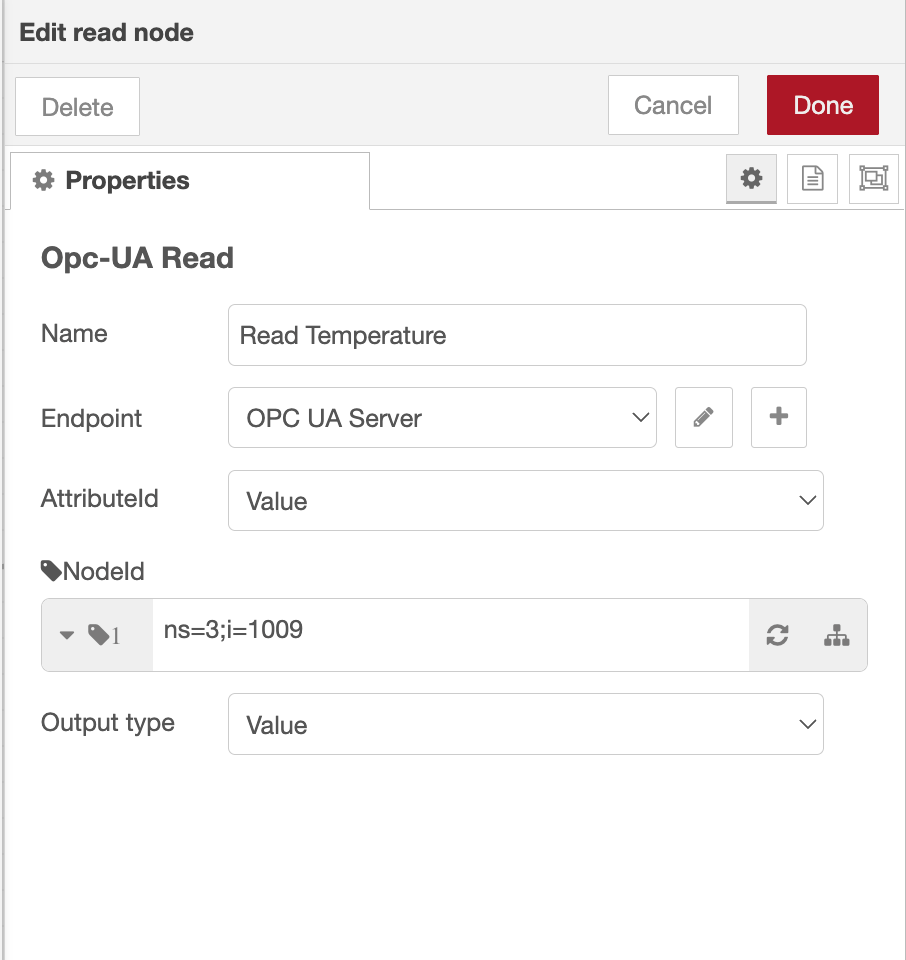
- Drag a Read node onto the canvas.
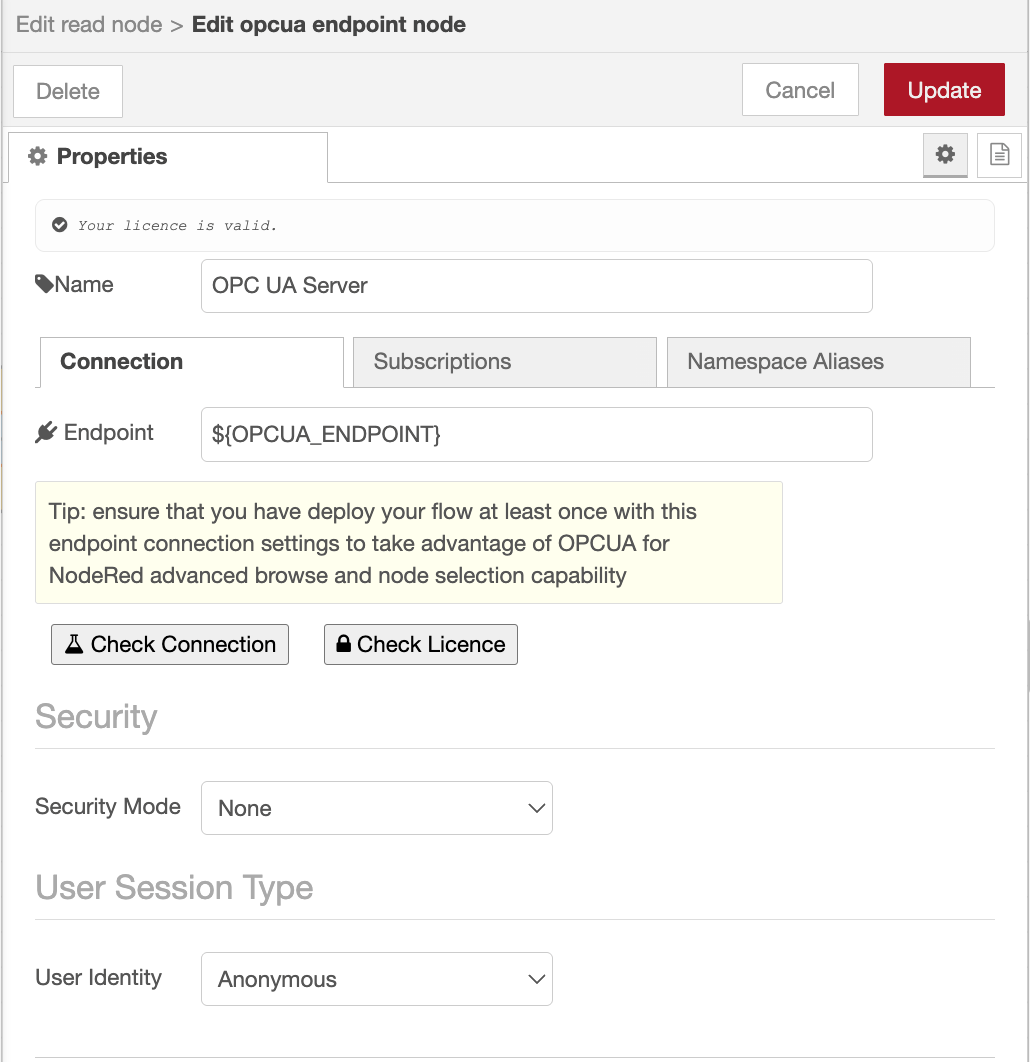
- Double-click it to open its settings, then click the "+" next to the Endpoint field to add a new endpoint configuration.
- Enter your endpoint URL, for example
opc.tcp://192.168.1.10:4840. - Set the Security Policy and Security Mode to match your server. For a local test server such as the Prosys simulator with security disabled, set both to
None. On production equipment, choose the certificate-based policy and mode your server requires, and point the node at your certificate and private-key files. - If your server needs credentials, enable the login option on the endpoint and enter the username and password. Otherwise leave it anonymous.
- Click Add, then Done.
Note: This guide uses a simulator server for convenience. On production equipment, always enable a certificate-based Security Policy and Mode rather than
None, so the connection between FlowFuse and your OPC UA server stays encrypted and authenticated.
Note: Store connection details, endpoint URLs, credentials, InfluxDB tokens, org and bucket names in environment variables rather than hardcoding them in your nodes. This keeps secrets out of your flows and lets you move the same flow between instances without editing each node. See Using Environment Variables for how to set them.
Read the values on a schedule
The Read node takes the Node ID of the tag from the incoming message, so feed it a message carrying the tag you want and it returns the value. First you need that Node ID, something like ns=3;s=Temperature.
- In the Read node, click the tree button next to the NodeId field. Enter the Node ID you want to drill into (a root node such as the Objects folder is the usual starting point), and the node renders your server's address space as an expandable tree. Drill down, click the tag you want, and its Node ID fills in automatically.
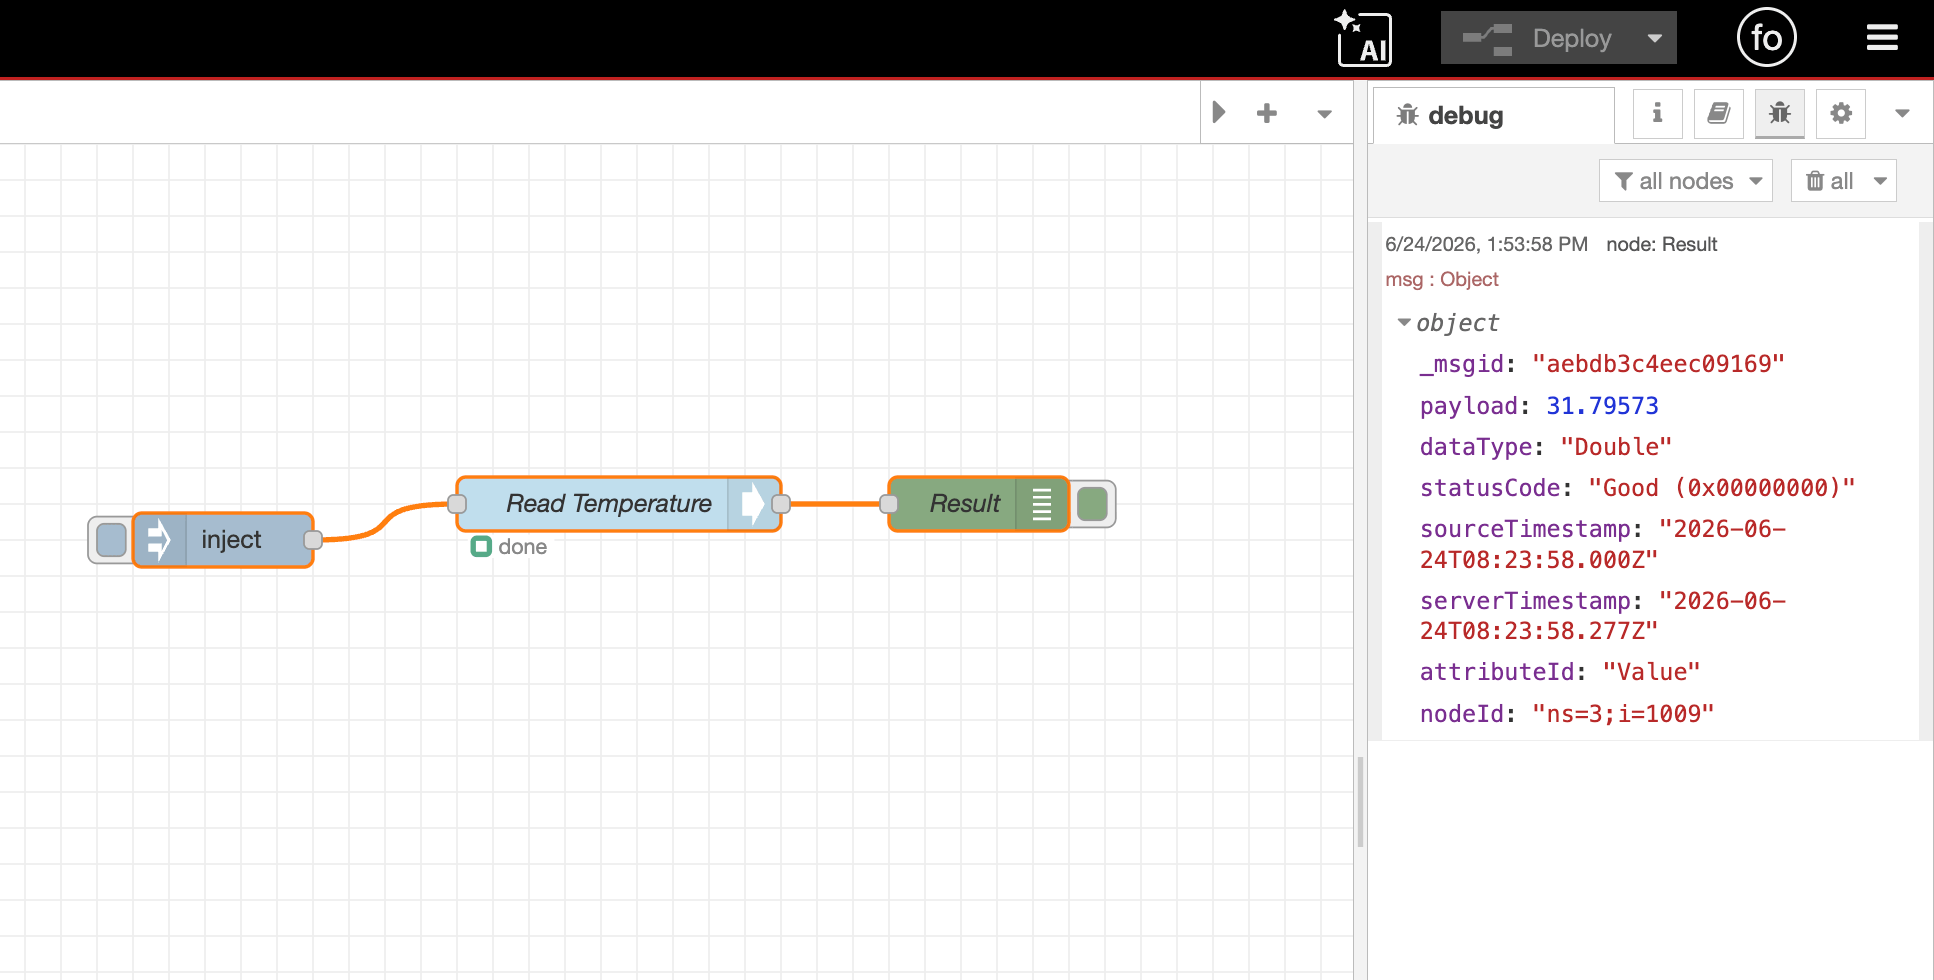
- Add an inject node and set it to repeat at a fixed interval, say every 5 seconds, so each pulse triggers a fresh read. Wire it into the Read node.
- Connect a debug node to the Read node's output, then deploy.
Each time a message arrives, the Read node returns more than just the number. The value lands in msg.payload, and the message also carries msg.dataType (such as Double or Boolean), msg.statusCode (Good on success, or an error like BadUnknownNode), msg.sourceTimestamp and msg.serverTimestamp as ISO strings, and msg.nodeId echoing back what was read. Watch that statusCode, it's how you tell a real 0 reading from a tag that failed to read at all.
To read several tags at once, pass an array of Node IDs in msg.topic or msg.nodeId and the node returns an array of values in msg.payload, more efficient than running a separate read per tag.
ℹ Tip: If you ever need the flow itself to discover Node IDs while it's running, say, to enumerate tags on a server whose address space changes, there's a dedicated Browse node for that. It's overkill for a fixed set of tags like this one, so we'll skip it here.
Deploy and watch the debug output. You should see a value arriving on each interval. The value itself is in msg.payload, while the timestamp and quality ride along on separate properties (msg.sourceTimestamp, msg.statusCode, and so on), so msg.payload is just the bare reading, like 42.5. That's the shape the next step builds on.
Writing Data to InfluxDB
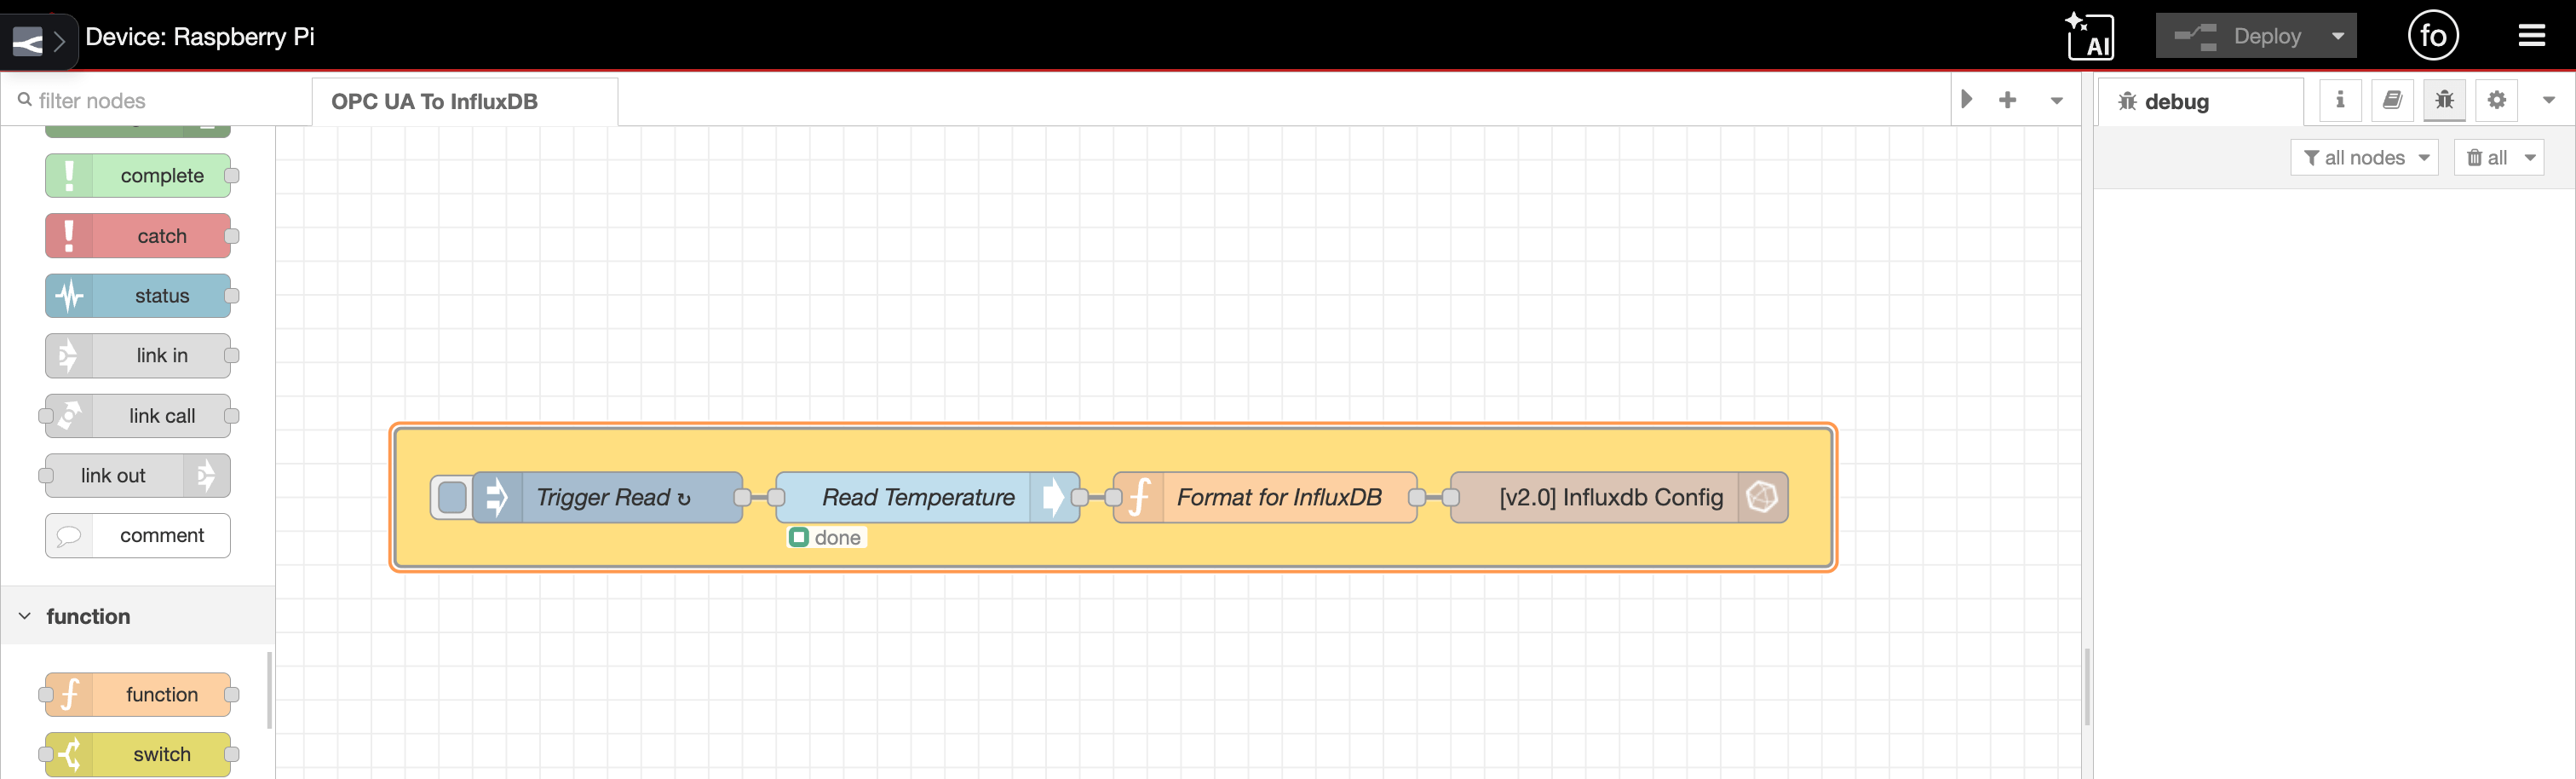
The OPC UA Read node and InfluxDB Out node use different message formats, so add a Function node between them to format the data before writing it to InfluxDB.
- Drop a Function node after the Read node and open it.
- Configure it to build the payload InfluxDB expects.
msg.payloadcontains the OPC UA value, andmsg.sourceTimestampcontains the timestamp from the OPC UA server:
const value = msg.payload;

msg.measurement = "equipment_readings";
msg.timestamp = msg.sourceTimestamp;

msg.payload = [
    {
        temperature: value
    },
    {
        sensor: "tank-1",
        location: "plant-floor"
    }
];

return msg;
The first object contains the field values, while the second contains tags used for filtering and grouping data during queries.
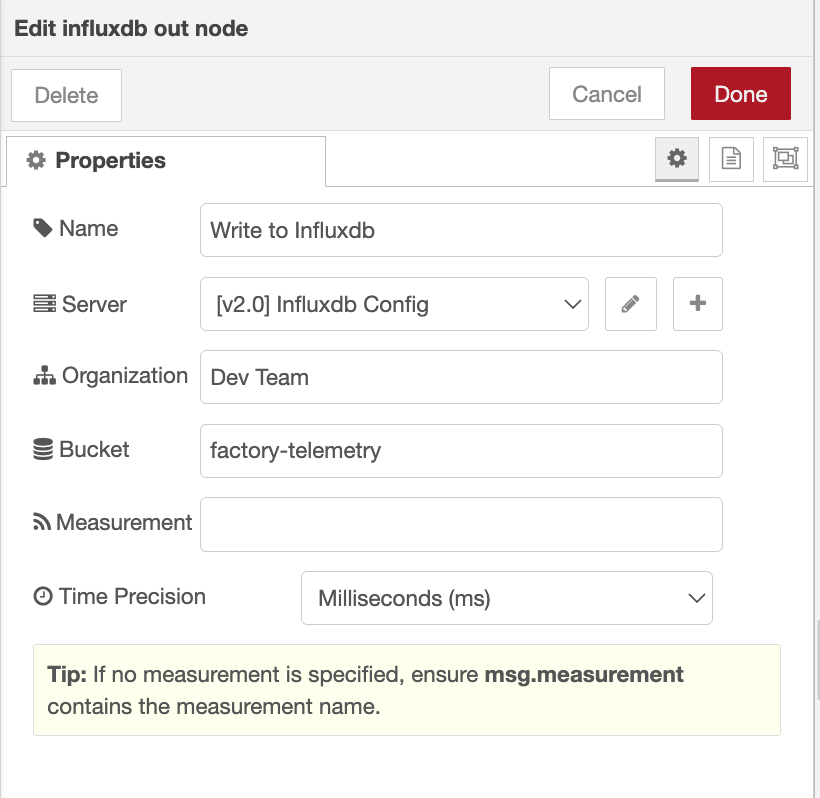
- Wire the Function node to an InfluxDB Out node.
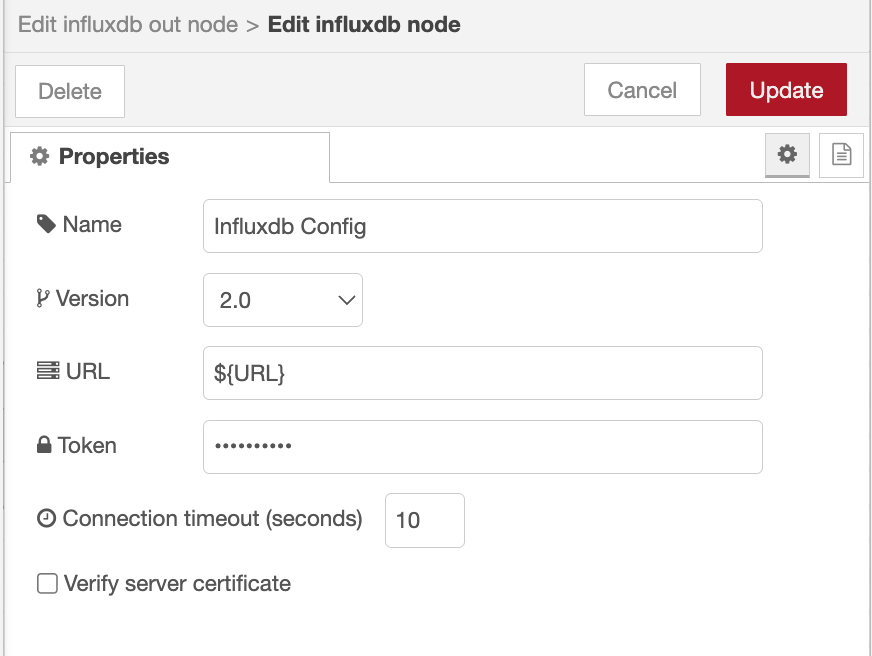
- Open the InfluxDB Out node and click the "+" icon next to Server to configure the connection. Enter your InfluxDB URL and select the appropriate version (1.x or 2.0).
- For InfluxDB 2.0, provide your Token, Organization, and Bucket. For InfluxDB 1.x, enter the database name and any required credentials.
- If you did not set
msg.measurementin the Function node, specify the measurement name (for example,equipment_readings) in the InfluxDB Out node configuration. - Deploy the flow.
Your readings are now flowing into InfluxDB. On each interval, the Read node retrieves the OPC UA value, the Function node formats it, and the InfluxDB Out node writes the timestamped data point to your bucket.
Verifying your data
Confirm the history is actually landing before you rely on it.
- Open the InfluxDB UI and go to the Data Explorer.
- Select your bucket, your
equipment_readingsmeasurement, and thetemperaturefield. - Set the time range to the last few minutes and run the query.
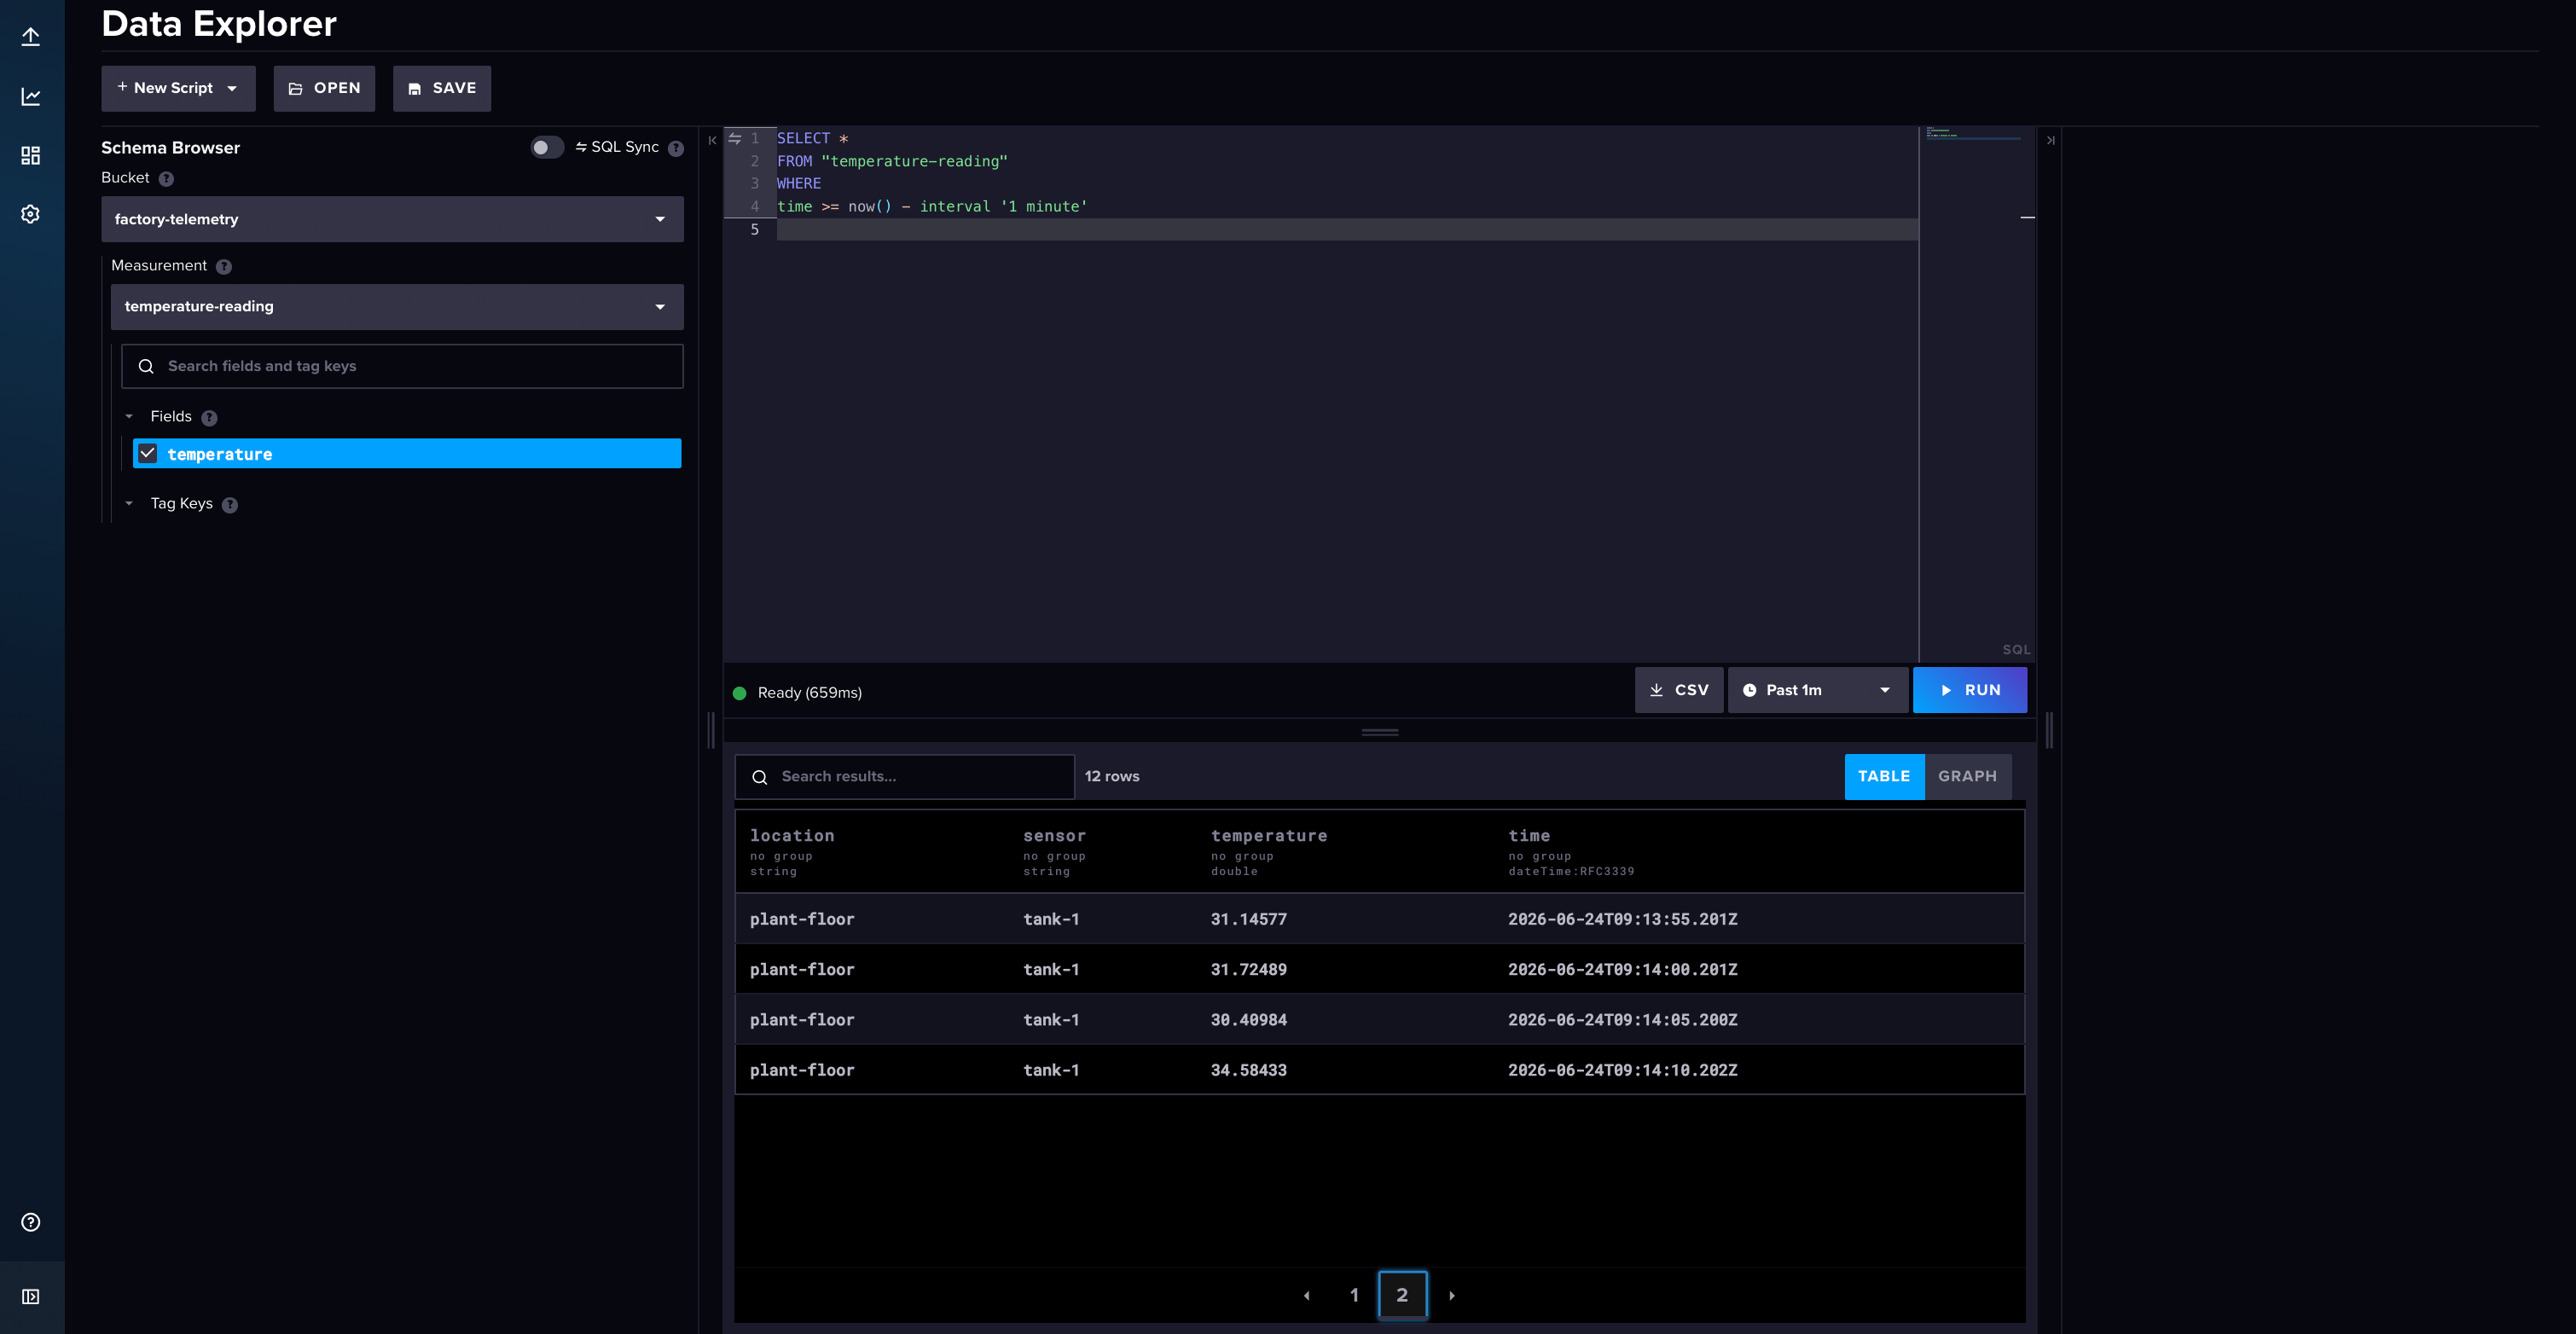
You'll see your readings listed in a table, one row per read interval. If new rows keep appearing as time passes, your pipeline is working end to end: equipment to OPC UA to FlowFuse to InfluxDB.
Storing data is only half the story. The InfluxDB In node lets you query readings back from InfluxDB, whether you need the latest values, historical trends, or aggregated metrics. You can then feed the results directly into a FlowFuse Dashboard to build charts, tables, and real-time monitoring views of your OPC UA data.
Where to go from here
You now have a durable, queryable record of your equipment's behavior. From here you can read more tags, tag each reading with its machine or line so you can slice the data later, and build dashboards on top of InfluxDB to chart trends and spot the slow drift that real-time values hide.
The real payoff comes when you stop reacting to problems and start seeing them coming. A pump that's drawing a little more current each week, a tank that's taking longer to fill, a temperature that's creeping past its usual range, all of it now sits in a history you can query, instead of vanishing the moment it happens.
Build on a foundation you can trust
FlowFuse Edge Certified Nodes are vetted, maintained, and tested by the FlowFuse team, so your OPC UA connections stay reliable in production. Contact sales to enable them for your team.
Frequently Asked Questions
About the Author
Sumit Shinde
Technical Writer
Sumit is a Technical Writer at FlowFuse who helps engineers adopt Node-RED for industrial automation projects. He has authored over 100 articles covering industrial protocols (OPC UA, MQTT, Modbus), Unified Namespace architectures, and practical manufacturing solutions. Through his writing, he makes complex industrial concepts accessible, helping teams connect legacy equipment, build real-time dashboards, and implement Industry 4.0 strategies.
Table of Contents
Like what you’re reading?
Add FlowFuse as a preferred sourceOn the page that opens, check the box next to flowfuse.com to see more of our articles in your Google Search results.
Related Articles:
- Turning an Application Idea into an Architecture
- Processing RTSP Camera Feeds at the Edge
- OPC UA Security: How to Establish a Defensible OPC UA Security Architecture
- OPC UA Security: How Threat Actors Exploit Industrial Protocol Vulnerabilities
- Why OPC UA Is Not Replacing Modbus (Yet)